Algorithm and parameter description
To start the transcript discovery:
Toolbox | Transcriptomics Analysis (![]() ) | Transcript Discovery
) | Transcript Discovery
Select the read mapping produced by the large gap mapper and click Next3.1. You are now presented with choices regarding the overall mode of analysis as shown in figure 3.1.
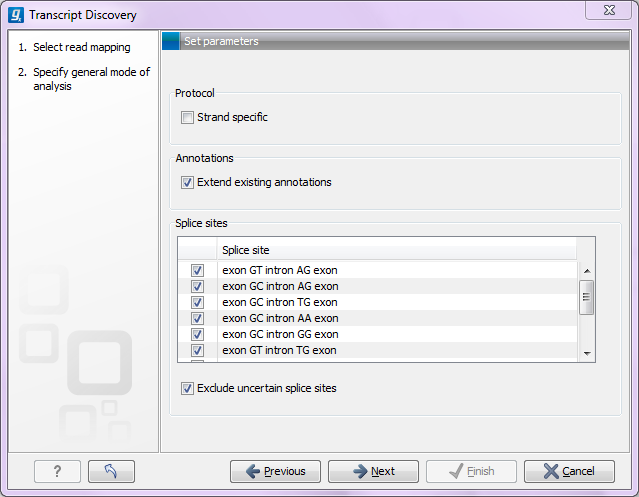
Figure 3.3: Specifying the overall mode of analysis.
- Protocol
- If a strand specific protocol was used for generating the reads in the mapping, select this option. It means that the strandedness of the predicted exons and splice sites will be defined by the strands on which the reads map. If a strand specific protocol was not used, the splice sites (see below) will be used to determine the strandedness.
- Use existing annotations
- This option allows you to enrich existing gene and mRNA annotations on the reference sequences of the mappings. It means that all existing gene and mRNA annotations will be kept, and new ones added only when the mapped reads suggest a new transcript or gene. When this option is not selected, existing gene and mRNA annotations -- if present -- will be ignored, and annotations will be generated solely based on the mapping of the reads.
- Splice sites
- The algorithm will examine each gap in the read mapping to see if the gap is placed at, or without cost can be moved to, a valid splice site based on the ones you select in this list. Gaps that are placed at or moved to one of these splice sites are defined as certain splice sites.
- Exclude uncertain splice sites
- For some gaps it will not be possible to place the gap at one of the defined splice sites, and these will be considered as gaps with uncertain splice sites and can be ignored by selecting this option.
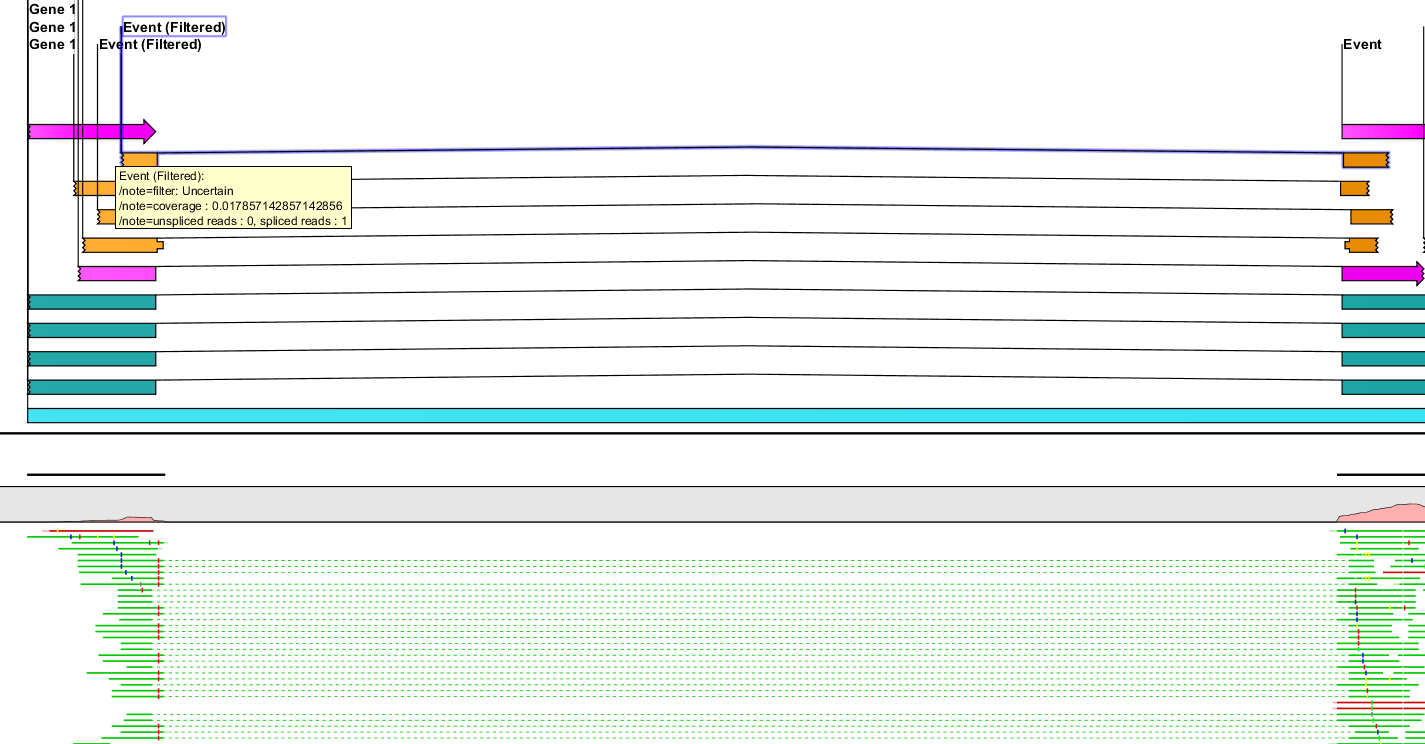
Figure 3.4: Events with certain and uncertain splice sites.
Click Next allows you to choose whether you wish to adjust a whole range of filtering parameters, or whether you prefer running the transcript discovery with default parameters (see figure 3.3).
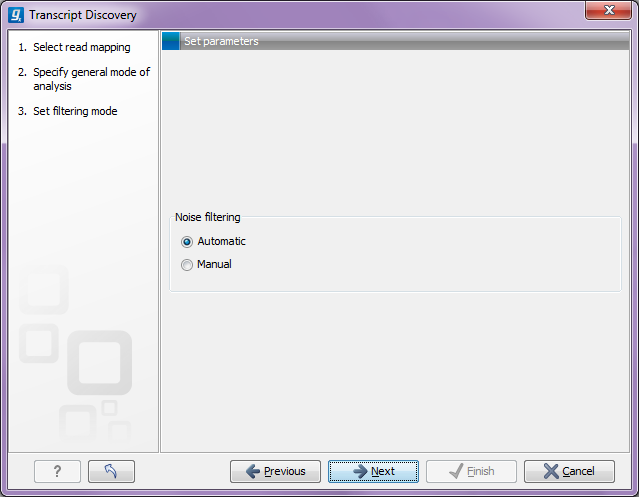
Figure 3.5: Specifying if filtering should be automatic or manual.
If you select Manual, you will be able to adjust all the filters (explained below). The filters are mainly in place to eliminate as much noise as possible and provide thresholds for defining valid genes and transcripts. If you select Automatic, default settings will be used. Since the result is quite sensitive to the values used in the filters, it will often be beneficial to adjust these. Often, it will require running the analysis a few times, inspecting the results and adjusting the filters accordingly.
Before proceeding with describing all the filters, some introduction to the underlying algorithm is needed. It consists of ten steps, outlined below. The step-wise examination will be supplemented with explanations of the options in the dialogs.
- Define events. This step examines each mapped read and converts it to a predicted event. In this first version of the plug-in paired reads are treated as two single reads, so that two independent events are created for reads in a pair. An event has a 'region', defined by the mapping region(s) of the read. If the read mapping is un-gapped, the event is just called an 'event' and its region consists of a single interval. If the read mapping has gaps, the predicted event will be called a spliced event, and its region will consist of more intervals. If you have specified canonical splice sites (see figure 3.1), the mapping will be checked to see if the gap is placed at, or without cost can be moved to, one of these. Events also have supporting read counts of spliced and un-spliced reads. At this point they are 1 and 0 for spliced reads and 0 and 1 for un-spliced reads. The supporting read counts are used in later steps for filtering and merging events. If the Use existing annotations option is selected, a gene region is defined for each annotated gene, and an event is produced for each annotated transcript. These are referred to as known events.
The 'Read filtering' options in the 'Event filtering' step are related to defining events:
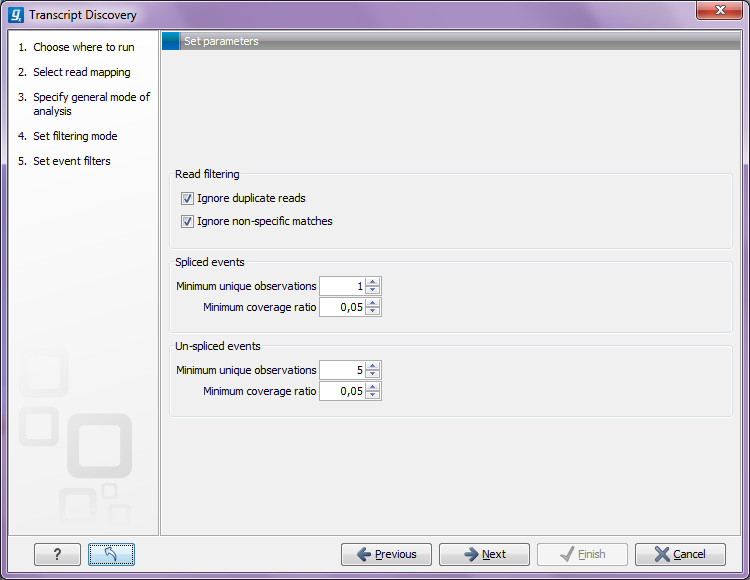
Figure 3.6: Specifying event filters.- Ignore match duplicates
- For reads that are 100% identical, only one copy is used to define events. This is relevant for the 'supporting read counts' that are used when filtering events. When ticked, identical reads will only be counted as '1' in the read counts.
- Ignore non-specific matches
- Reads that have an equally good match elsewhere on the reference genome (these reads are colored yellow in the mapping view) can be ignored in the analysis. Whether you include these reads or not will be a tradeoff between sensitivity and specificity. Including them may lead to the prediction of transcripts that are not correct, whereas excluding them may mean that you will loose some true transcripts.
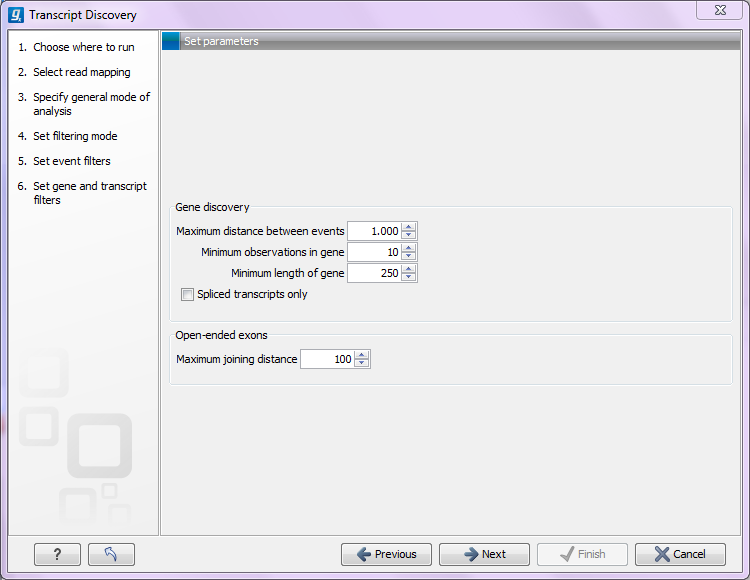
Figure 3.7: Specifying transcript and gene filters. - Identify regions of coverage. A region of coverage is a region in the mappings that contains events that are close enough to belong to the same gene. Regions of coverage are identified by iterating through the predicted events while calculating the distance between the current and the next event. If this is less than the Maximum distance between events value (see figure 3.5) the current region is extended. If not, a new region is started. If the 'Use annotations' option is ticked, the annotated gene regions take priority over the distance between events requirement; that is, if the next event lies within a region of an annotated gene that is different to that of the current event, a new region of coverage is started, even though the events are closer than the 'maximum distance between events' value.
Please note that a 'region of coverage' is not a gene region -- it may contain more gene genes. The potential gene regions within a region of coverage are found in a later step (see step 6 below).
- First round of merging events. To reduce the number of events before proceeding with the analysis, we merge events that unequivocally support the same splice sites. While doing this, the supporting read counts for the merged events are summarized. In this first round of merging, we merge strictly overlapping events. Two events are strictly overlapping if (1) the events overlap, (2) all introns and exons of the events in the overlapping region are the same and (3) the non-overlapping parts of the events do not extend across any splice site positions of any other events in the coverage region. The requirement (3) ensures that we do not merge an event with another event in cases where there are more events supporting different splice sites with which it could be merged.
- Fix end- and splice-points. Many events will have end points that are slightly off, mostly because the first few (respectively last) bases of the intron and the end of the following (respectively preceding) exon are identical, or because they really should have been mapped with a gap, but a too short part of the read was present on one side of the gap for the mapper to map it, so instead it was mapped, possibly with a few nucleotides into an intron, and an unaligned end (see an example in figure 3.6).
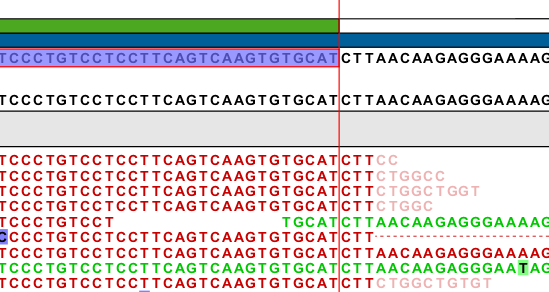
Figure 3.8: The four reads at the top and the read at the bottom all have aligned three nucleotides into the intron (based on the existing transcript annotation) and with an unaligned end. These nucleotides actually map perfectly at the next exon, but the large gap mapper is not able to align parts that are smaller than 17 bp.Also, splice sites may not have been found, due to errors in the read. To account for this we fix end and splice points of the events. This is done for each coverage region, by collecting all the certain splice sites observed in the region (based on the sequence of the splice site, see figure 3.1) in a list. For each event in the region, it is then examined whether its end points or splice positions are close (less than 9 bp) to one of the sites in this list of observed certain splice sites. If so, the end or splice points of the event are moved, and the event is given the note Boundaries are moved based on events in vicinity (this can be seen on the event annotation as shown in figure 3.7).
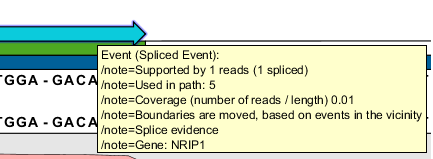
Figure 3.9: The annotation tells you that the boundaries for this event were moved in the Fix end- and splice points step. - Second round of merging events. The fixing of end and splice points above alters the set of events within a coverage region, and typically causes events that were not mergable before the fixing took place to now be mergable. To further reduce the number of events, we carry out a second merging of events that unequivocally support the same splice sites, while again adding read counts of merged events. This time the merging consists of two steps:
- Merge contained events
- For each event, it is examined if it is contained in another event. If so, it is merged with the other event, meaning that the supporting read counts of the contained event is added to those of the containing event. An event is contained in another event if all its introns and exons are present in the other event. An event can be contained in several other events, which means that the supporting read counts will be added to each of those events.
- Merge strictly overlapping events
- see above ('First round of merging').
- Split in genes. As some genes lie close and/or overlap, a coverage region may contain more genes. The next step is to split the events within a region of coverage into, possibly several, potential gene regions. If no annotations are used, the split-in-genes step just splits the events on strands:
- Assign all events that are on the forward strand to a 'forward strand' region.
- Assign all events that are on the reverse strand to a 'reverse strand' region.
- For an un-stranded event: if it intersects with the region spanned by the forward stranded events, and not with that of the reverse stranded event, assign it to the forward strand region. It the opposite is the case, assign it to the reverse strand region. Else, assign it to the region whose' events have the highest summed read count.
- Create a gene region for the events assigned to the forward strand, and another for those assigned to the reverse.
If annotations are used, the procedure is more complicated:
- Create a list of the regions of the known genes in the coverage region.
- For each event in the region, collect a list of those of the known genes that it might belong to; the 'possible' genes. If the event is stranded, this list contains all of the known genes in the region that have the same strand as the event, and whose' region intersects with the event. If the event is un-stranded, the list contains all genes whose' region intersects with the event.
- If there is just one possible gene for an event, we assign it to that gene. If there are more possible events, we prefer a gene that completely overlaps with the event. If there are more of these, we prefer the shortest. If there are no possible genes for an event, but it intersects with an event that has been assigned to a gene and that is not on a different strand, assign it to the gene of that event. If there are events left after this that have not been assigned to a gene, use the 'split on strand' procedure described above, to create gene regions for them.
- Filter events. Some events in the gene regions may be supported by just a few reads. To remove these noise events you can apply a number of event filters (see figure 3.4):
- Spliced events:
- Minimum unique observations
- (Filtering of spliced events with weak evidence). The minimum number of unique spliced reads that must support an spliced event. Events that do not meet this requirement are ignored. A read is unique if it 'counts' as specified by the 'Read filtering' options in 3.1: If the 'Ignore duplicate reads' option is ticked, identical spliced reads are counted as 1, and if the 'Ignore non-specific matches' is ticked, non-specific matches are not counted.
- Minimum coverage ratio
- (Filtering of spliced events with weak relative evidence). The spliced coverage of a region is calculated as the number of spliced reads in the gene region, divided by the total length of the region consisting of the union of the exons in the events in the region. Similarly, the spliced coverage of an event is calculated as the number of spliced reads supporting the event, divided by the length of the exon regions of the event. If the the spliced coverage of the event divided by the spliced coverage of the region is smaller than the user specified value, the event is ignored. Compared to the filter on absolute read count above, the coverage ratio filter allows filtering of events with weak evidence in regions of high coverage.
- Un-spliced events:
- Minimum unique observations
- (Filtering of events with weak evidence). The minimum number of unique un-spliced reads that must support an un-spliced event. Events that do not meet this requirement are ignored.
- Minimum coverage ratio
- (Filtering of events with weak relative evidence). The un-spliced coverage of a region is calculated as the number of un-spliced reads in the transcript event region, divided by the total length of the region consisting of the union of the exons in the events in the region. Similarly, the un-spliced coverage of an event is calculated as the number of un-spliced reads supporting the event, divided by the length of the exon regions of the event. If the the un-spliced coverage of the event divided by the un-spliced coverage of the region is smaller than the user specified value, the event is ignored.
- Exclude intron-exon events:
- For each un-spliced event, it is examined if there are spliced events with which it is incompatible (if there is, the un-spliced event is an event that extends across an exon-intron boundary, but that does not have an alternative splice site). If so, the un-spliced event is ignored (see 3.8).
- Exclude internal un-spliced
- All events that lie within introns of other events, and do not overlap with any other event are excluded. This ensures that spurious expression within introns is ignored.
- Exclude external
- External events without spliced reads are excluded if their coverage is less than 25% of that of the event with maximum coverage in the gene region. External events are those that lie upstream or downstream of all events with splice evidence. This ensures that spurious weak expression most upstream or downstream in the region of coverage is ignored.
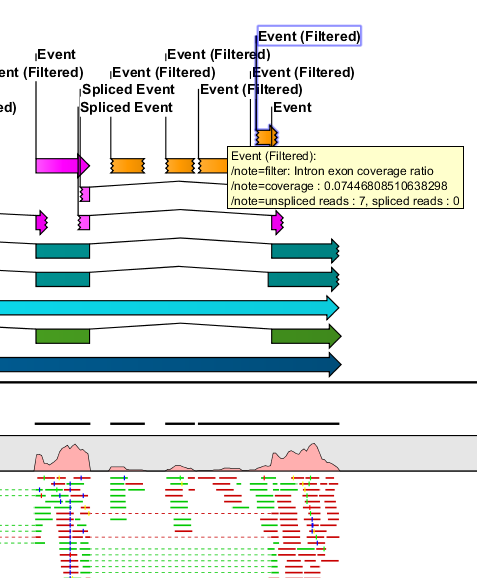
Figure 3.10: Event filtered on intron/exon ratio.
- Third merging of events. Having excluded events in the filtering step, some events may now be mergable, that were not before the filtering. We thus apply a third round of merging of strictly overlapping events (described above).
- Predicting transcript annotations. For each gene region, transcript annotations are created by a two-step procedure:
- Identifying events belonging to a transcript
- First we build a directed graph which has as nodes the events in the graph. Events are sorted by starting positions. A directed edge is added between nodes (from the first to the last) if the events are compatible. Two events are compatible if they, in their overlap, support the exact same splice junctions. We use the Dijkstra algorithm [Dijkstra, 1959] to identify a set of paths through the graph that completely covers the nodes. While building paths, the supporting read counts of the events are used as weights, and the path with the highest weight is preferred. Each resulting path contains a set of events that belong to the same transcript.
- Converting paths to transcripts
- For each path, a transcript is defined by merging the events in the path. Open-ended exons are joined if their distance is below the Maximum joining distance (see figure 3.5).
- Identifying genes. Finally, a gene is predicted if the sum of the read counts of the events in the transcripts for the gene is above the Minimum observations in gene value (see figure 3.5), and the length of the gene (from beginning of first exon to the end of the last exon) is larger than the Minimum length of gene value (see figure 3.5). If the option 'Spliced transcripts only' is selected, genes without spliced transcripts will be ignored and only genes with spliced transcripts are predicted.
Footnotes
- ...Next3.1
- Please note that if your mapping used paired data, the reads will be treated as single reads.