Split Read Mapping By Cell
Split Read Mapping By Cell splits an input Read Mapping (
Chromatin Accessibility (![]() ) | Split Read Mapping By Cell (
) | Split Read Mapping By Cell (![]() )
)
There are two types of output:
- A Graph Track (
 ) suitable for visualizing scATAC-Seq peaks per grouping.
- A Read Mapping (
 ) per grouping, which can be used as input to Single Cell ATAC-Seq Analysis to analyze a subset of previously analyzed data.
The options control the groups of cells for which an output is produced:
- Clusters and Cell annotations. Clusters accepts Cell Clusters (
 ) and Cell annotations accepts Cell Annotations (
 ).
).
- Group by. One or more columns from the supplied Cell Clusters or Cell Annotations. If neither is supplied, then it is only possible to group by `Sample'. Columns that only contain non-integer numerical data are not supported. If Cell Clusters contained a column `Cell type' with values `T cell', `B cell' and `Platelet', and Cell Annotations contained a column `Status' with values `Case' and `Control', then selecting Group by = Cell type, Status would give groups `T cell - Case', `T cell - Control', `B cell - Case', `B cell - Control', `Platelet - Case', and `Platelet - Control'.
- Select groups (Optional). This can be supplied to reduce the number of groups to only those of interest. If left empty, all groups will be output.
The tool also outputs a Report (![]() ) summarizing the input and the resulting cell groups.
) summarizing the input and the resulting cell groups.
Peak graph tracks
The Create peak graph tracks option creates a graph of fragment coverage for each group of cells. Only paired end reads are used to create the graph - broken pairs are discarded. Fragments are corrected to the cut site by offsetting read start sites by +4nt for forward reads and -5nt for reverse reads. The peak graph track often provides a more intuitive visualization of peaks than a Read Mapping and uses much less diskspace. The visualization is more intuitive because the unsequenced part of each fragment that lies between the two reads of a pair is counted towards the coverage of the peak graph, but does not count towards the coverage of the Read Mapping.
It is recommended to only create peak graph tracks on read mappings that have been produced by Single Cell ATAC-Seq Analysis, as otherwise the presence of duplicate reads can make peaks less clear.
Peak graph tracks can be scaled in two ways. Scaling does not affect the relative height of peaks within the same track, and so is only useful when comparing peaks in two different tracks:
- No scaling. The height of the graph track corresponds to the number of fragments sequenced at each position. With this scaling, if one track has 5 times more reads in a peak than the other, then the height of the peak will be 5 times greater. This allows the signal strength for each peak for a group of cells to be seen.
- Scale by number of cells. The height of each graph track is scaled by the number of cells in a group. With this scaling, if one track has 5 times more reads in a peak than the other, but also 5 times more cells in the group, then the heights of the peaks will be the same. This allows the shapes of peaks from large and small groups of cells to be compared.
To visualize the effect of scaling in a Track List, all graph tracks must be shown on the same scale. To do this, check the Fix graph bounds option in the side panel. The effect of different settings is shown in figures 9.4-9.6.
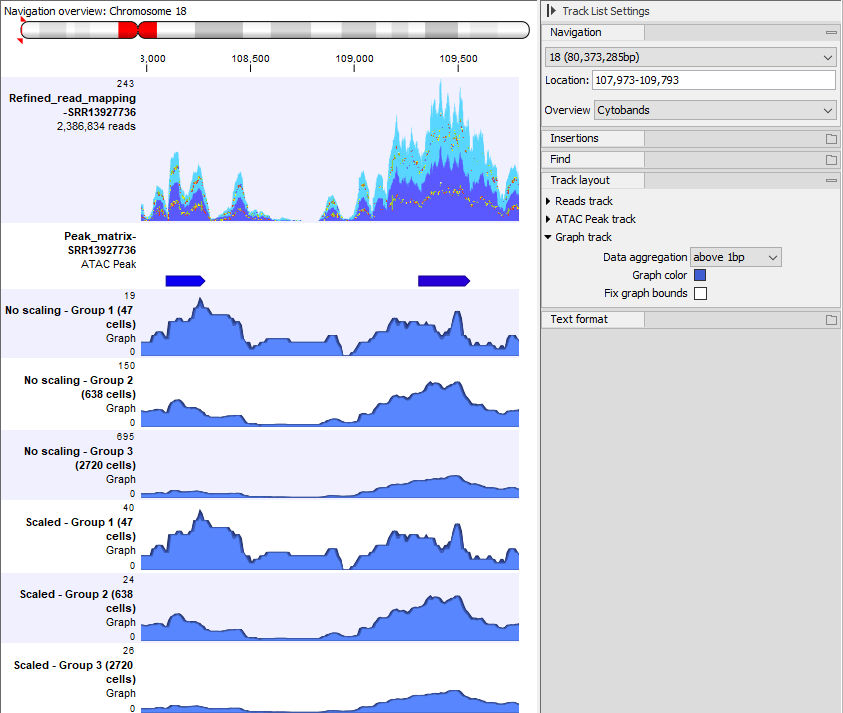
Figure 9.4: A Track List showing the Read Mapping coverage graph (top), called peaks, and peak graph tracks for three groups of cells of very different sizes. Fix graph bounds is not checked in the side panel, so each graph track is independently rescaled to use the available space. This means that the graph tracks for each group appear the same regardless of whether they have no scaling or are scaled by number of cells. Data is for one sample from [Taavitsainen et al., 2021].
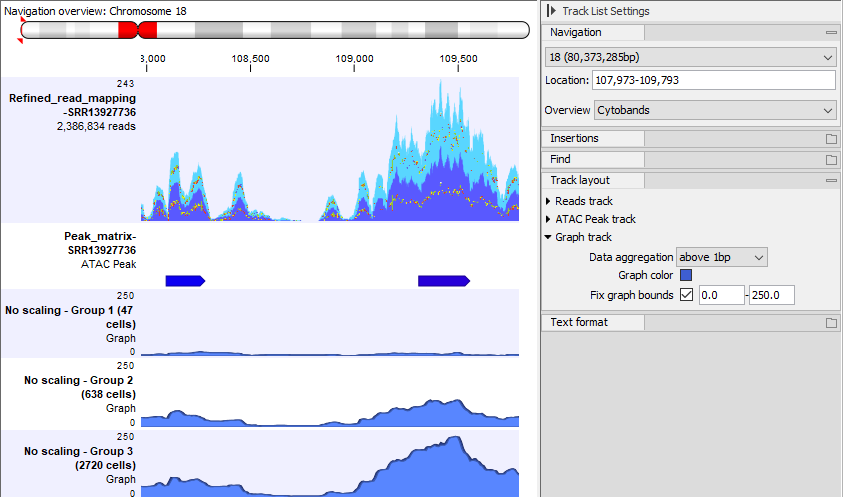
Figure 9.5: The same Track List as in figure 9.4, but only showing the graph tracks without scaling and with Fix graph bounds checked in the side panel. There are many more cells in group 3 than in group 1, and this is reflected by the heights of the graphs - the signal at each of the two peaks is much stronger in group 3 than in group 1.
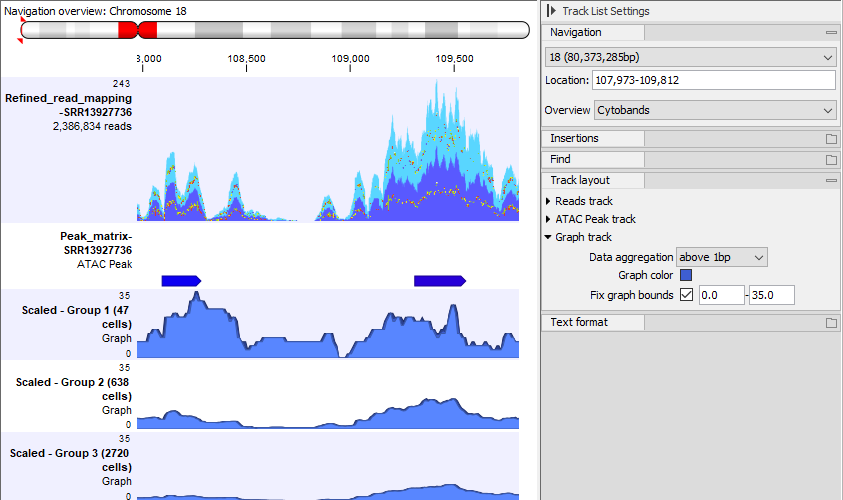
Figure 9.6: The same Track List as in figure 9.4, but only showing the graph tracks with scaling and with Fix graph bounds checked in the side panel. The heights of the graphs are much greater in group 1 than in group 3. This is because a greater fraction of the cells in group 1 than in group 3 have reads in the peaks.
Reads tracks
The Create reads tracks option creates a Read Mapping for each group of cells. Unlike Create peak graph tracks, no filtering or post-processing of the reads is applied: the output includes paired end reads and broken pairs, and the original alignment coordinates are preserved (i.e. there is no correction to the cut site).
Report
The report lists how many fragments and cells were found in the input Read Mapping:
- Fragments tables will be produced separately for paired and single reads, if there are any such reads. Both paired reads and single reads count as one fragment. Note that a broken pair of reads will be listed as two separate single reads and so will count as two fragments.
- Cells are split into matched and unmatched cells. If single reads are present (for example, due to the presence of broken pairs), then the unmatched cells will be further split into cells that are unmatched because they are not part of any group, and cells that are unmatched because they have no paired reads.
For each resulting cell group, the number of cells in the group is reported.