Convert Clonotypes to Cell Annotations
The Convert Clonotypes to Cell Annotations tool can be found in the Toolbox here:
Immune Repertoire (![]() ) | Convert Clonotypes to Cell Annotations (
) | Convert Clonotypes to Cell Annotations (![]() )
)
The tool takes a Cell Clonotypes (![]() ) element as input and produces a single Cell Annotations (
) element as input and produces a single Cell Annotations (![]() ) element, containing, for each barcode, the following categories for the identified (paired and unpaired) chain types and primary / secondary clonotypes (determined through the number of reads) (see figure 10.5):
) element, containing, for each barcode, the following categories for the identified (paired and unpaired) chain types and primary / secondary clonotypes (determined through the number of reads) (see figure 10.5):
- productive status;
- V gene;
- J gene;
- V and J genes;
- CDR3 length;
- the CDR3 amino acid sequence;
- the number of UMIs and reads supporting the clonotype (only for unpaired chains).
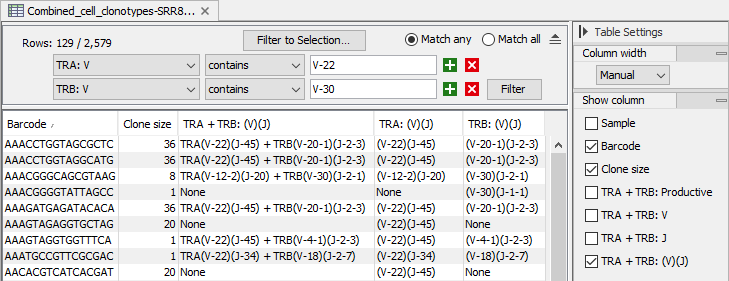
Figure 10.5: View of a Cell Annotations element obtained from the Convert Clonotypes to Cell Annotations tool, filtered to specific V genes and where only the V and J genes are shown for the primary clonotypes and the TRA + TRB, TRA and TRB chains. Not all barcodes have identified clonotypes for both TRA and TRB chains.
The output Cell Annotations element additionally contains the 'Clone size' for each barcode: the number of barcodes it shares its primary clonotype with.
|
Note: The clone size reflects only the paired primary clonotypes. Let us consider the following example, where each column represents one barcode, and the rows identify the
|
Using the resulting Cell Annotations element, the cells can be colored by any of the above categories in a Dimensionality Reduction Plot (see Dimensionality reduction) obtained from matched scRNA-Seq data for the same cells (see figure 10.6).
|
The cells in the Dimensionality Reduction Plot and those in the Cell Annotations need to have the same sample name. Ideally, it should be ensured that these share the sample name as a first step in the analysis pipeline, when running the Annotate Reads with Cell and UMI tool (see Annotate Reads with Cell and UMI), or when importing the Cell Clonotypes element (see Import Cell Clonotypes). If this has not been done, the sample name can be updated using the Update to Common Sample Name tool (see Update to Common Sample Name). |
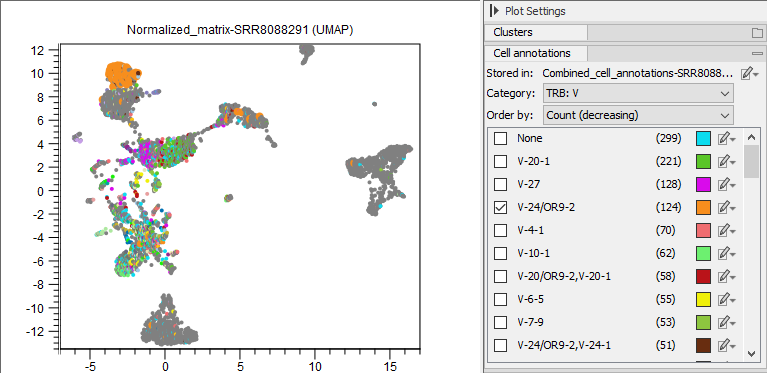
Figure 10.6: UMAP view of scRNA-Seq data, where cells are colored by the V gene from the TRB chain.
Note that the Convert Clonotypes to Cell Annotations tool only converts the primary and secondary clontypes for each barcode. The Cell Clonotypes created by the Single Cell TCR-Seq Analysis only contain primary / secondary clonotypes, but the Combine Cell Clonotypes tool can lead to barcodes containing more clonotypes.