Interpreting the output of Train Cell Type Classifier
Train Cell Type Classifier produces the following outputs:
- A single Cell Type Classifier (
 ) element.
- A single Report (
 ) summarizing the cell types added to the classifier, the performance of the new classifier on validation data (if provided), and any regressions compared to an existing classifier (if provided).
The Cell Type Classifier output
The table view of the Cell Type Classifier gives a summary of (figure 6.4):
- the cell types the classifier has been trained on;
- which features the classifier uses to distinguish the cell types;
- how many cells the classifier has been trained on;
- how many and which samples the classifier has been trained on.
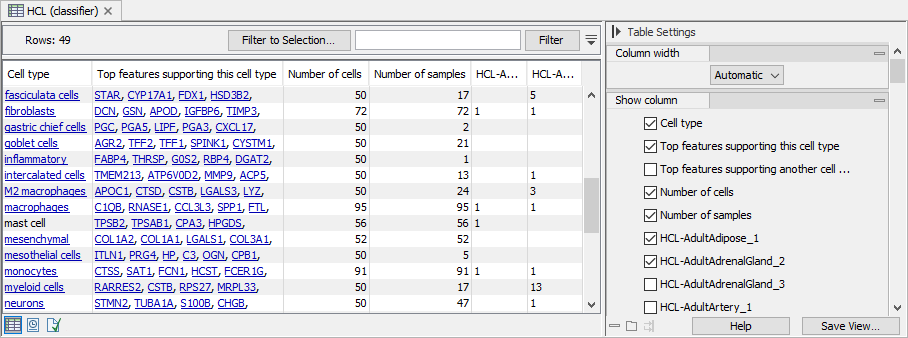
Figure 6.4: The table view of a Cell Type Classifier trained on HCL data (http://bis.zju.edu.cn/HCL) containing 106 different samples. For cell types present in more than 50 samples, one cell is chosen from each sample. The sample columns (here, starting with "HCL-") contain the number of training cells used from the respective sample. The "Top features" columns list the most important features used by the classifier to distinguish each cell type from the rest.
Cell types that are in the QIAGEN Cell Ontology (see The QIAGEN Cell Ontology) are clickable and the links open the ontology browser with the corresponding cell type selected. In figure 6.4, 'mast cell' is missing a link because this cell type is named 'mast cells' in the ontology. For ensuring that the link between cell types and the ontology is present, use 'Map clusters to QIAGEN Cell Ontology' when importing clusters (see Import Cell Clusters) and use the ontology when defining new clusters in a Dimensionality Reduction Plot (see Manual Annotation).
The impact of the strategy for choosing cells during training when extending a classifier with new data (see Train Cell Type Classifier) can be investigated in the sample columns of this table view.
The classifier assigns weights to each feature according to how informative it is for distinguishing each cell type from the rest. The "Top features supporting this cell type" and "Top features supporting another cell type" list up to 10 features with the largest weights. If a cell has high expression for the features in "Top features supporting this cell type", it is a good indication that it is of that specific cell type, while if it has high expression for the features in "Top features supporting another cell type", it is a good indication that it is not of that specific cell type. Note that the classifier uses more information than that summarized in these two columns, and the combined expression for all features together with the assigned weights is used for predicting cell types.
If the top features are assigned ids from either Ensembl or Entrez, the feature names are clickable and the link opens the corresponding Ensembl or Entrez webpage.
|
Top features and markers. The top features identified by the classifier are different than the markers identified by the Differential Expression for Single Cell tool (see Differential Expression for Single Cell). A cell type marker has different expression in the cell type compared to all other cell types, and this is calculated independently for each feature. The classifier top features are useful jointly in recognizing a specific cell type, but might not necessarily be very informative on their own.
|
The report output
The report has up to 4 sections depending on whether validation data or an existing classifier were provided.
Input data cell types
The input data are the matrix and clusters from which cells are added to the classifier. They are distinct from the validation data. The training data is the subset of the input data that is added to the classifier, and the data already present in the existing Cell Type Classifier, if used.
The first table in this section lists the cell types in the input that have the exact same name as a term in the QIAGEN Cell Ontology. The second table lists the remaining input cell types.
When both tables have entries, it is recommended to check for spelling mistakes or redundancy. For example, in figure 6.5, some cells are annotated by a spelling mistake of "T lymhpocytes", and others are annotated as "perithelial cells" - which is a synonym of the term "pericytes" from the first table. The classifier will have attempted to learn all four types separately, which will likely harm performance.
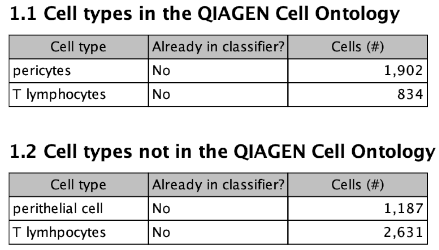
Figure 6.5: The "Input data cell types" section of the report. In this case, section 1.2 contains cell types that are spelling mistakes and synonyms.
The tables have the following columns:
- Cell type. The name of the cell type.
- Already in classifier?. This column is only shown when an existing classifier is provided and indicates whether the classifier has already been trained with this cell type.
- Cells (#). The number of cells in the input with this type. The classifier will be trained with approximately 50 cells per cell type. If the cell type is already in the classifier, as little as one additional cell of this type may be added during training.
The predictions of cell types that are already in the classifier and do not have a very small number of cells (e.g. ![]() ), are likely to be more accurate than predictions of new cell types with few cells.
), are likely to be more accurate than predictions of new cell types with few cells.
Validation data cell types
This section is only present when validation data is supplied to the tool.
Where possible, a performance assessment of the new classifier is made for each cell type in the validation data.
When no assessment is possible, a table lists the affected cell types and the reasons why assessment is not possible. The reasons are:
- No validation data. All the cells in the validation data are part of the training data. A performance assessment based on training data would not provide a good estimate of the actual classifier performance or whether a regression occurred.
- Cell type is not in the classifier. The new classifier (and therefore also the existing classifier, if supplied) does not contain the cell type. The classifier(s) will never predict this cell type correctly.
The Performance summary for validation data cell types table lists the remaining cell types in alphabetical order. Performance is measured based on the classifiers' prediction of the cell type for each cell - no cells are left unlabeled. This corresponds to the "Cell type (all)" category of the Cell Clusters element produced by the Predict Cell Types tool.
Three columns are always present:
- Cell type. The name of the cell type.
- In input data? Whether the input data contains this cell type.
- Cells (#). The number of cells used for validation.
When no existing classifier is provided, the following column is shown:
- Correct (
 ). The overall correct () from all validation data.
When an existing classifier is provided, the following additional columns are shown:
- Regressed matrices (#). The number of validation matrices where the correct () worsened by more than the allowed threshold.
In general, regressions can be explained by misannotations in either the input or validation data. A regression seen in many matrices e.g., "4 (of 5)" is likely to indicate misannotation in the input data. If the regression is reported for "1 (of 1)", it is hard to determine whether the misannotation is in the input or validation data.
A row is added in the subsequent tables for each regressed matrix, together with more information which can help understanding the possible cause of the regression.
- Change correct (). The difference between New correct () and Old correct ().
If the absolute value is larger than the allowed threshold, the corresponding entry in the 'Cell type' column will be colored green if the change is positive (better prediction), or red, if the change is negative (worse prediction).
- New correct (). The correct () for this cell type using the newly trained classifier.
- Old correct (). The correct () for this cell type using the previous classifier.
The correct (![]() ) is calculated as the number of cells that are correctly predicted with the respective cell type out of the the total number of cells that are annotated with the cell type. When multiple validation matrices are used, matrices with more cells will have more influence. This is because each cell is weighted equally. Note that this allows an arbitrary weighting of the validation matrices by choosing subsets of cells in the desired proportions.
) is calculated as the number of cells that are correctly predicted with the respective cell type out of the the total number of cells that are annotated with the cell type. When multiple validation matrices are used, matrices with more cells will have more influence. This is because each cell is weighted equally. Note that this allows an arbitrary weighting of the validation matrices by choosing subsets of cells in the desired proportions.
Note that large apparent regressions in performance may be spurious if the number of cells in the validation data is very low. For example, if there are 5 cells, a ![]() regression indicates that only a single additional cell was predicted incorrectly.
regression indicates that only a single additional cell was predicted incorrectly.
Regressions for cell types not/in input data
These tables are only produced when both validation data and an existing classifier are provided. They list cell types in alphabetical order contain a row for each matrix in the Regressed matrices (#) column of the Performance summary for validation data cell types table.
For each matrix, the additional ![]() of incorrect predictions is listed, if:
of incorrect predictions is listed, if:
- the exceeds the allowed threshold;
- the predicted cell type is in the input data.
These are divided into three categories, depending on the relationship between the validation and predicted cell type. Direct relationships describe whether two cell types are more or less specific descriptions of the same type. They are found by mapping the two cell types to the QIAGEN Cell Ontology via a list of known synonyms.
- Incorrect. No direct relationship can be determined. Either the mapping has been successful and the cell types are not directly related, or the mapping is not possible.
It may be that an "Incorrect" cell type prediction is acceptable. For example, the validation cell type may differentiate into the predicted one, or the two types may be subtypes of the same cell type. Sometimes both explanations are possible, for example "mature B lymphocytes" and "plasma cells" are both subtypes of "B lymphocytes", and mature B lymphocytes differentiate into plasma cells.
- Less specific. The predicted cell type may be technically correct, but it is less specific than the validation data cell type e.g., the predicted type is "B lymphocyte", but the validation type is "mature B lymphocyte".
- More specific. The predicted cell type is a more specific type than the validation data cell type e.g., the predicted type is "mature B lymphocyte", but the validation type is "B lymphocyte".
Ideally, no cell types should be listed in the Less specific and More specific categories for the Regressions for cell types in input data table. This is because the input data includes both the validation and predicted cell type, so the use of the validation cell type instead of the predicted cell type was deliberate. Such cases always merit investigation.
The presence of cell types in the Less specific category is always a cause for concern. It suggests that the newly trained classifier has lost some of the existing classifier's ability to predict cells specifically.
The presence of cell types in the More specific category can be benign. It suggests that the newly trained classifier has gained the ability to predict cells specifically. Care should be taken to ensure that this explanation is plausible, for example, perhaps the more specific cell type has just been added to the classifier and/or was absent in the matrix for which the regression occurred. If the more specific cell type is localized to a particular tissue e.g. "ovarian vascular surface endothelial cells" instead of "endothelial cells", then it can be checked whether the validation matrix is expected to include cells from that tissue and whether the classifier contains a more appropriate cell type that was not predicted.