Interpreting the output of Train Cell Type Classifier
The tool outputs a Cell Type Classifier (![]() ) object. The table view of the object gives a summary of the cell types the classifier has been trained on, including the number of cells that have been used from each sample (figure 7.3). The impact of the strategy for choosing cells during training when extending a classifier with new data (see Train Cell Type Classifier) can be investigated in this table view.
) object. The table view of the object gives a summary of the cell types the classifier has been trained on, including the number of cells that have been used from each sample (figure 7.3). The impact of the strategy for choosing cells during training when extending a classifier with new data (see Train Cell Type Classifier) can be investigated in this table view.
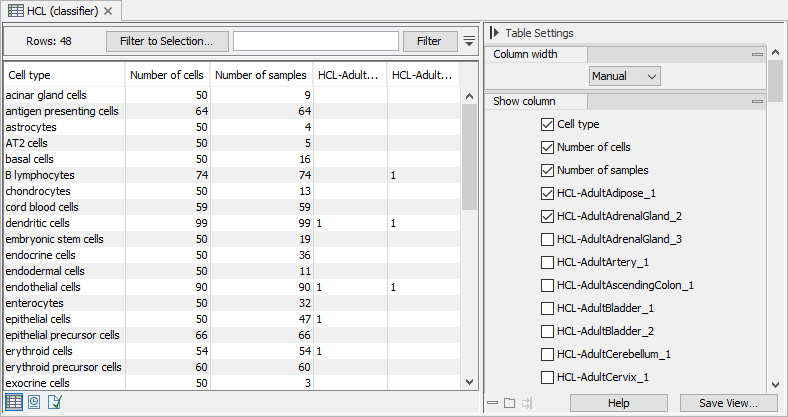
Figure 7.3: The table view of a Cell Type Classifier trained on HCL data (http://bis.zju.edu.cn/HCL) containing 106 different samples. For cell types present in more than 50 samples, one cell is chosen from each sample. The sample columns (the two right-most columns and the remaining unselected columns) contain the number of training cells used from the respective sample.