The user interface
The Biomedical Genomics Workbench user interface includes the Toolbox, Navigation Area, Menu Bar, Toolbar, Side Panel, View Area, View Tools, and Status Bar (figure 2.3).
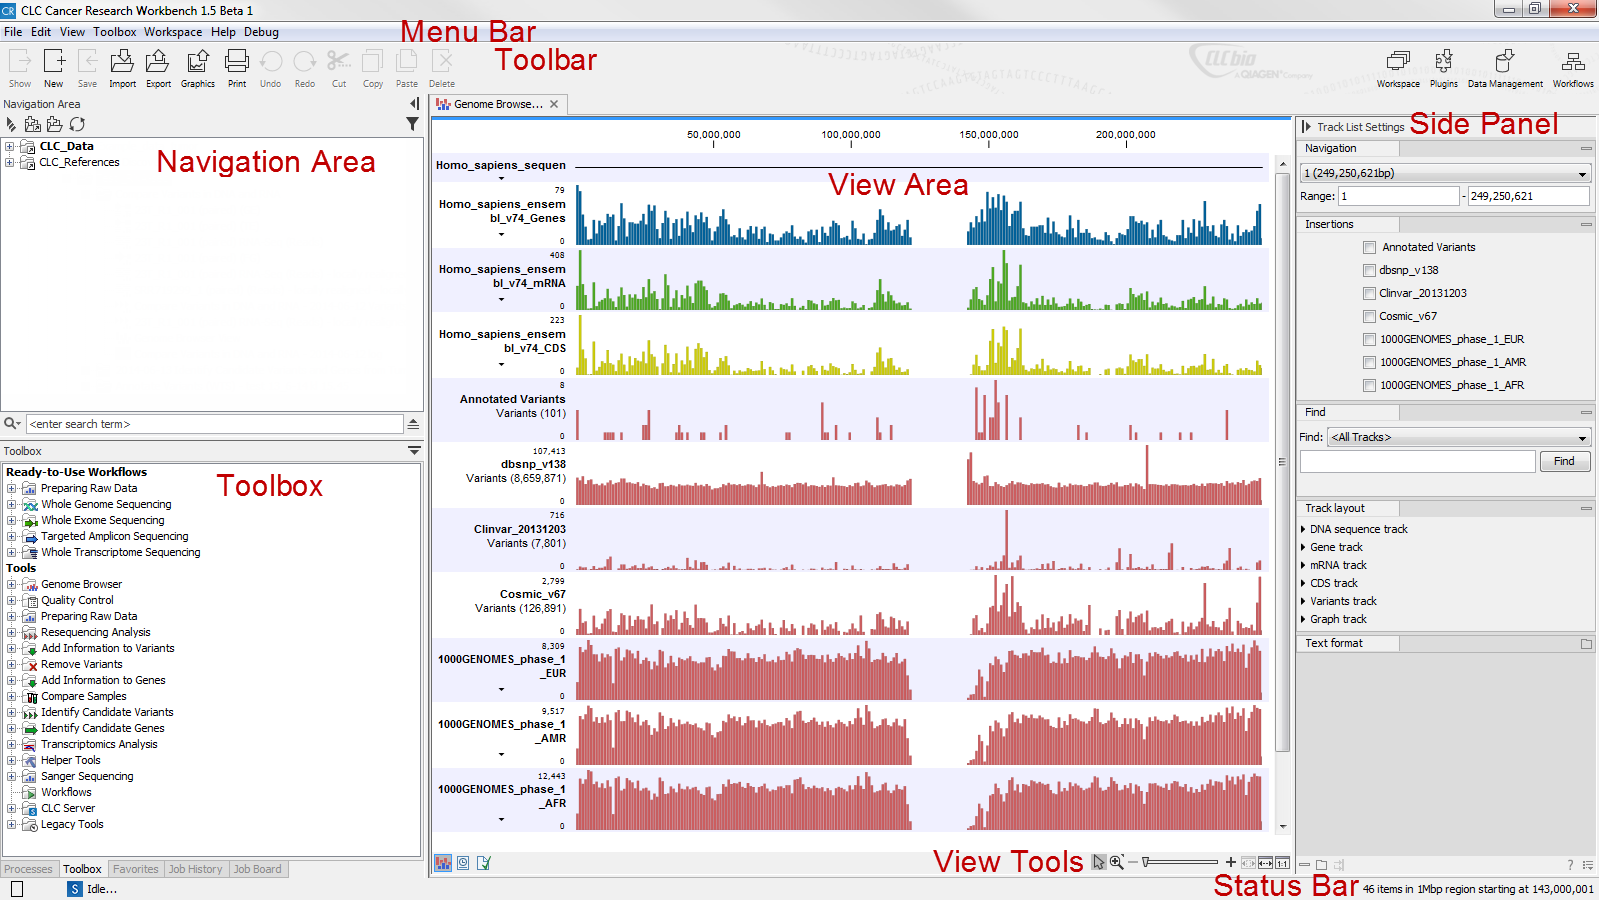
Figure 2.3: At the top you find the Menu Bar and under that, the Toolbar. The Navigation Area is on the left. Here, you can view and organize your data, and from here, you can open data to view, select it for launching in applications. Saved data will appear within this area. The Toolbox is available in two locations in the Workbench. One is in a tab of the pane below the Navigation Area. The other is via the menu system. The Toolbox is where Workflows and most tools that play a role in your data analysis are launched from. When opened, datasets are shown in the View Area along with a Side Panel appears that allows you to customize the viewing options and also navigate to specific areas of the data. At the bottom of a data view on the right, are the View Tools that can be used for panning, zooming and selection of specific regions. At the bottom on the left are icons allowing to view data in a different way, for example look at a table view of the data or view the history of actions taken on that dataset. The Status Bar in the lower right corner indicates the location of a selection you have made or where the mouse pointer is pointing to within a dataset with co-ordinates, such as a track or sequence.
After a dataset is opened, for example by double-clicking on an item in one of the folders visible in the Navigation Area, the user interface will look similar to that shown in figure 2.3. Each dataset in the View Area will have an associated Side Panel, Status Bar, and a set of View Tools.
The Side Panel, Status Bar, and View Area are only visible when data are open for viewing. When no datasets are open, the view is like that in figure 2.1.
Subsections