Sankey plot for Clonotypes
The Sankey plot view (
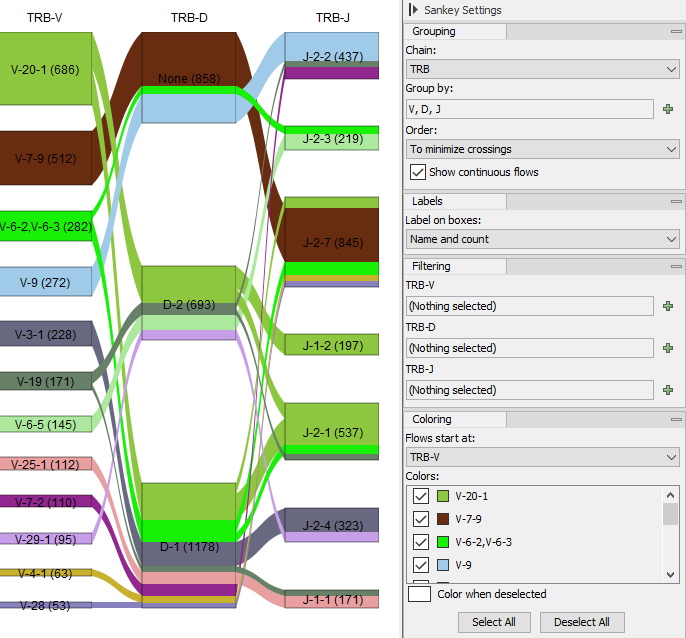
Figure 7.14: Sankey plot for the TRB chain showing V, D and J segments. Numbers in brackets show the total count for the corresponding clonotypes. Flows show how many clonotypes with the specific segment combination are present. Clonotypes without D-segments are represented by the "None" box.
For each selected segment type, the plot has a column that contains boxes for each segment. The box height reflects the total count for clonotypes with the given segment. The boxes are connected with flows. "Show continuous flows" controls the type of the flows:
- If not ticked, there are flows between boxes in consecutive columns for clonotypes having segments corresponding to the boxes. The height of the flow indicates the total count for these clonotypes.
- If ticked, the flows start from a fixed column. As before, flows between boxes in the first two columns reflect clonotypes with segments corresponding to the two boxes. Flows between boxes in the second and third column reflect clonotypes corresponding to the boxes in both the first, second and third column, and so on.
In both cases, the color of a flow indicates the element where the flow starts. "Flows start at" can be used to change the start column, by default the leftmost.
"Show continuous flows" has no effect when there are less than three columns.
Boxes can be removed from the plot by using the options under "Filtering" in the side panel (figure 7.14). The plot will show only boxes for the selected segments and the boxes to which the selected segments have a flow to (figure 7.15). If multiple filters are used, boxes are subject to all the restrictions (figure 7.16).
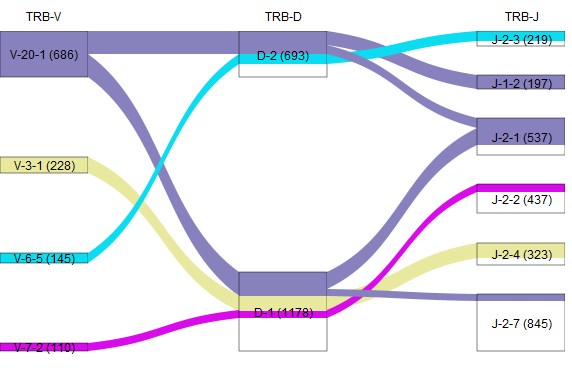
Figure 7.15: Sankey plot for the TRB chain showing V segments restricted to V-20-1, V-3-1, V-6-5 and V-7-2. Boxes for D and J segments are only shown for segments present in clonotypes having one of the selected V-segments.
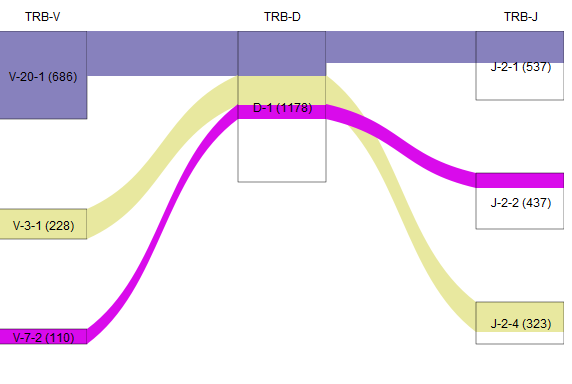
Figure 7.16: Sankey plot for the TRB chain showing V segments restricted to V-20-1, V-3-1, V-6-5 and V-7-2; D segments restricted to D-1; and J segments restricted to J-2-3, J-2-1, J-2-2, J-2-3, and J-2-4. Note that V-6-5 is not in the plot because there are no clonotypes with V-6-5, D-1 and one of the selected J-segments.
The columns and their order can be changed by using the options under "Group by" in the side panel (figure 7.14). The CDR3 amino acid sequences can also be shown, see figure 7.17.
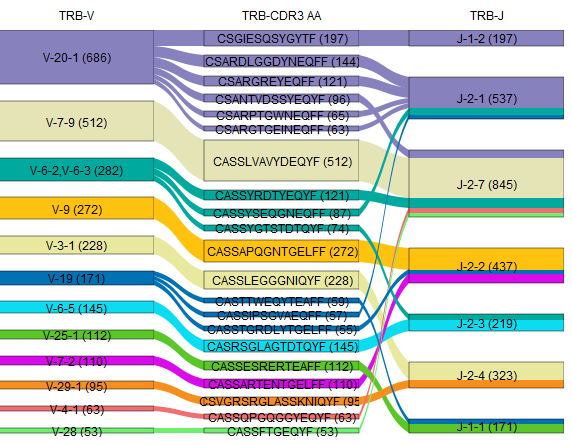
Figure 7.17: Sankey plot for the TRB chain showing V segment, CDR3 and J segment.