Rarefaction for Clonotypes
The rarefaction curve (- interpolated down to 0 clonotypes;
- extrapolated to twice the total number of detected clonotypes.
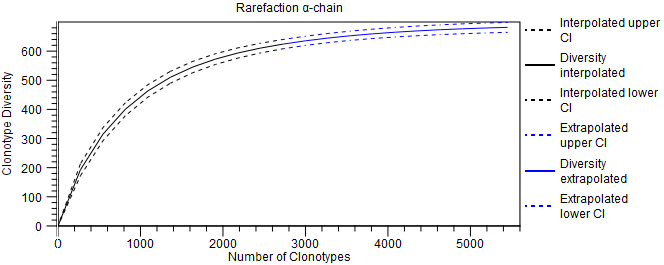
Figure 7.18: Rarefaction plot for the TRA chain. The chain can be changed from the side panel.