Cumulative frequencies for Clonotypes

The cumulative frequency curve (Image histogram_dense_16_n_p) shows the cumulative frequencies of the identified clonotypes, ordered by descending count (figure 7.21). If the curve is steep in the beginning and then flattens, it indicates that a few clonotypes account for most of the reads. On the other hand, if the curve is more linear, it indicates a more even distribution of reads among the clonotypes.

Image immune_cumulative_freqs
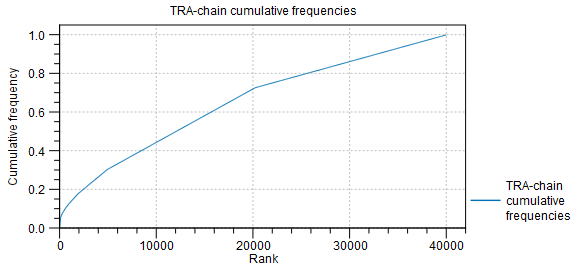
Figure 7.21: The cumulative frequencies of the TRA chain. The chain can be changed from the side panel.