CDR3 length for Clonotype Sample Comparison
The CDR3 length plot (
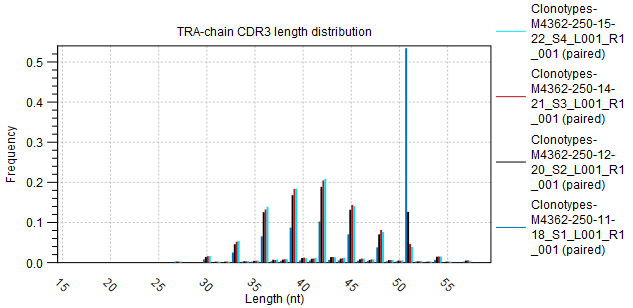
Figure 7.25: CDR3 length distribution plot for the TRA chain. The samples and chain can be changed from the side panel.
Figure 7.25: CDR3 length distribution plot for the TRA chain. The samples and chain can be changed from the side panel.