Rarefaction for Clonotype Sample Comparison
The rarefaction curve (
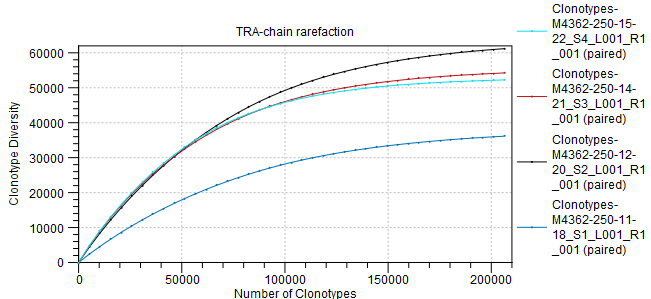
Figure 7.24: Rarefaction plot for the TRA. The samples and chain can be changed from the side panel.
Figure 7.24: Rarefaction plot for the TRA. The samples and chain can be changed from the side panel.