Audit log
The audit log records the actions performed on the CLC Server.
Opening the audit log
The audit log is located at:
Management (![]() ) | Audit log (
) | Audit log (![]() )
)
By default, only administrative users have access to this area, but this can be extended to members of other groups (see Web admin access).
When first opened, the 50 most recent operations are listed. A different number of items to list per page can be specified using the Page size drop-down list in the Database Search Filters area above the audit log. The older and newer links below that allow for swift navigation through the audit log (figure 14.1).
Filtering the audit log
The time period of interest can be specified using an option in the Time drop-down list, or by specifying times in the After and/or Before fields (figure 14.1).
The list can also be restricted to just those submitted by a certain user, jobs that passed or jobs that failed, and to certain types of operations.
Note: Data management operations log the movement of data into or out of recycle bins and data deletion (emptying of recycle bins). Other data related activities are not recorded in the audit log.

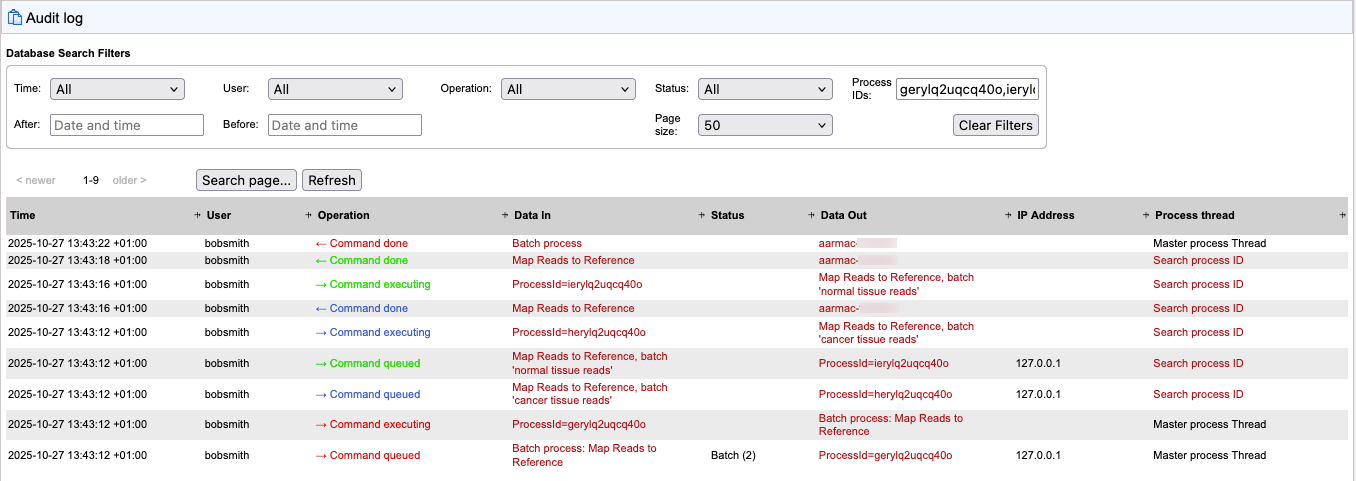
Figure 14.1: Audit log entries for a batch run of Map Reads to Reference. The job was sent for execution on a grid setup.
Clicking on the Search process ID link in the Process thread column enters the process ID into the "Process IDs:" field in the Database Search Filters area and results in just the activities for a given process being listed. To see all processes listed again, click on the Clear Filters button.
Clicking on the "Search process ID" link for a master process restricts the operations listed to just those of the master process and the jobs it initiated. The example in figure 14.2 shows the audit log entries for a Map Reads to Reference batch job with two batch units. Operations are color coded according to the job or process they are associated with.

Figure 14.2: The process threads for a batch run of Map Reads to Reference containing two batch units. Operations relating to the whole job are displayed using red text. The three process threads for each of the mapping jobs are also color coded; blue text for the first batch, green text for the second batch.
Reviewing audit log entries
Information in the Data In and Data Out columns are often hyperlinked. Clicking on these links reveals detailed information about the activity.
Failed jobs have a red exclamation mark in the Status column of a "Command done" operation entry. Clicking on the link in the "Data Out" field for that operation opens a dialog with additional information about the problem.
Searching the audit log
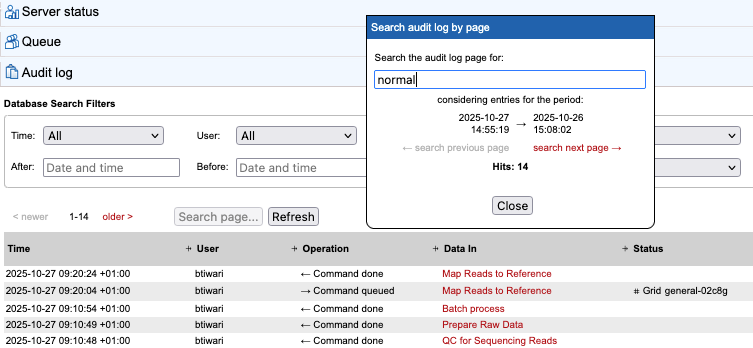
Click on the Search page... button to search for terms of interest within the entries visible in the audit log. Searching additional entries is supported from within the dialog (figure 14.3).

Figure 14.3: The dialog opened by clicking on the "Search page..." button. The term "normal" was found 14 times within the list of entries originally visible. Those 14 entries found remain visible. Clicking on the "search next page" link supports quickly searching through additional audit log entries.
Execution environment information
Jobs submitted to a grid setup have "Grid <grid preset name>" in the Status field. After such jobs are finished, the name of the grid node, grid preset and grid job ID are included in the summary text provided in the Data Out field of "Command done" operations (figure 14.1).
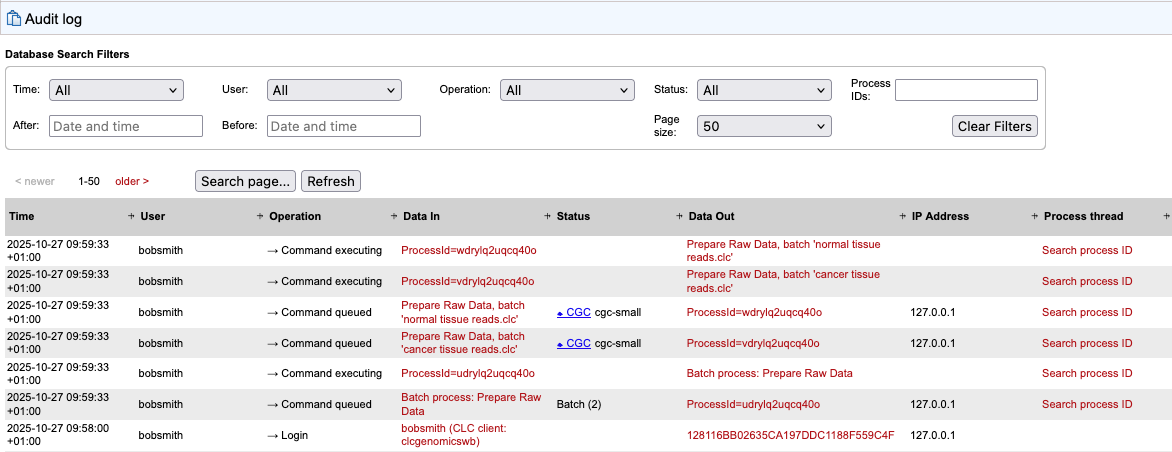
Jobs submitted to a CLC Genomics Cloud setup have "CGC <cloud present name>" in the Status field. After such jobs are finished, additional details about the execution are included in the summary text provided in the Data Out field of "Command done" operations.
For jobs running or previously run on a CLC Genomics Cloud setup, clicking on the CGC link in the status column provides additional information about the job and the results. See the CLC Cloud Module manual for further details.

Figure 14.4: Audit log entries for a batch run of the Prepare Raw Data template workflow. This job was sent for execution on a CLC Genomics Cloud setup using the cloud preset called "cgc-small". Clicking on the CGC link opens a dialog with further information about the job and the results.
Audit log database and text files
Audit log information is stored in a database. Once a month, and when the CLC Server is started up, entries in the audit log older than 3 months are deleted.
The limit the audit log database can grow to is 64 GB. If a new entry will push the size past this limit, the system will remove some of the oldest entries so that is is possible for newer entries to be added.
Audit information is also written to text-based log files. Upon the first activity on a given date, a new log file called audit.log is created. This file is then used for logging that activity and subsequent Server activities on that day. When this new audit.log file is created, the file that previously had that name is renamed to audit.<actual events date>.log. These log files are retained for 31 days. When the creation of a new audit.log file is triggered, audit log files older than 31 days are checked for and deleted.
The audit log files can be found under the Server installation area under webapps/CLCServer/WEB-INF.
The audit log text files are tab delimited and have the following fields:
- Date and time
- Log level
- Operation: Login, Logout, Command queued, Command done, Command executing, Change server configuration, Server lifecycle; more may be added and existing may be changed or removed.
- Users
- IP Address
- Process name (when operation is one of the Command values) or description of server lifecycle (when operation is Server lifecycle)
- Process identifier - can be used to differentiate several processes of the same type.
- Status - can be used to identify whether the entry was successful or not, e.g. if a job execution failed it will be marked here. Any number other than 0 means failed.
