Create Expression Browser
The Create Expression Browser tool makes it possible to inspect gene, transcript or miRNA expression level counts, annotations and statistics for many samples at the same time. Further, the plotting functionality helps with visualizing the data in an easy to interpret way.
To run the tool, go to:
Toolbox | RNA-Seq and Small RNA Analysis (![]() )| Create Expression Browser (
)| Create Expression Browser (![]() )
)
Select some expression tracks (![]() ). These can be either Gene level (GE) or Transcript level Expression (TE) tracks, but not a combination of both (see figure 31.2).
). These can be either Gene level (GE) or Transcript level Expression (TE) tracks, but not a combination of both (see figure 31.2).
Click on the Next button.
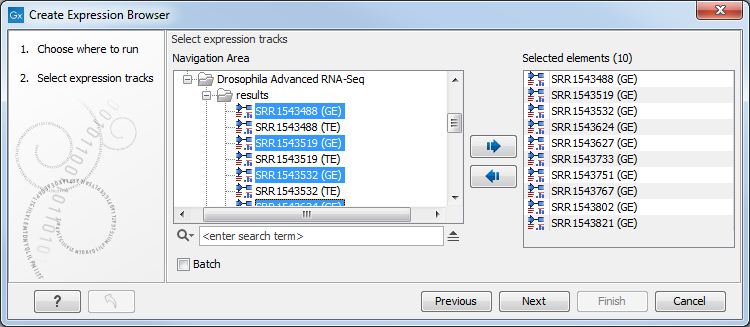
Figure 31.5: Select expression tracks, either GE or TE.
In the second wizard dialog, statistical comparisons and an annotation resource can be selected (see figure 31.3). Information from the selected elements is included in the expression browser.
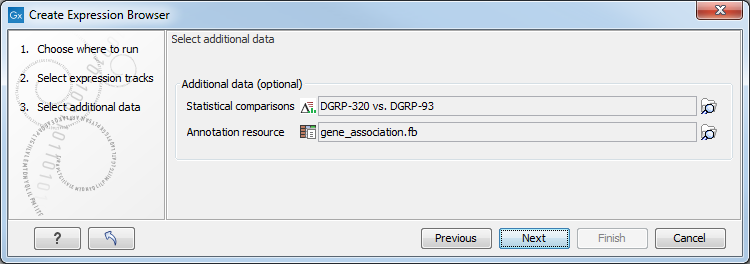
Figure 31.6: Information from statistical comparisons and an annotation resource can optionally be included in the expression browser being created.
Statistical comparisons are generated by differential expression tools, described in Differential Expression. The selected statistical comparisons must have been created using the same kind of expression tracks as those selected in the first wizard step. For example, when creating an expression browser using GE expression tracks, statistical comparisons must have been generated using GE tracks.
Annotation resources can come from various sources:
- Annotations from the Gene Ontology consortium at http://current.geneontology.org/products/pages/downloads.html. The files downloaded from there can be imported using the Standard Import tool.
- Annotations contained in tables. To use such tables as an annotation resource, at least one column must have a header from the list in table 31.4, spelled exactly as shown, and contain identifiers that can be matched with identifier information in the selected expression tracks. Where more than one column has a header from that list, the column with the most matching identifiers is used to determine the row each annotation should be added to.
Excel and CSV format files can be imported as tables using the Standard Import tool. For CSV format files, force the import type to "Table in CSV format (.csv)".
Table 31.4: Column headers for columns containing identifiers. Accession GeneName RefSeq transcript ID Ensembl GeneSymbol RefSeq_ID EnsemblID GI RefSeqAccession Entrez gene Gid RGD name Entrez_Gene_ID Identifier SGD accession number EntrezGeneID MGI name Symbol Feature ID Name Transcript FlyBase Primary accession Transcript ID GenBank accession PrimaryAccession Transcript ID(Array Design) Genbank identifier Probe Set ID transcript_cluster_id Gene ID Probe_Id WormBase Gene name ProbeID Gene symbol RefSeq accession
- Annotations generated by the "Blast2GO PRO" plugin
(see https://digitalinsights.qiagen.com/plugins/blast2go-pro/). - Annotations for human, mouse and rat bundled with Reference Data Sets.
Subsections