Scatter plot
As described in Scatter plot view of an experiment, an experiment can be viewed as a scatter plot. However, you can also create a "stand-alone" scatter plot of two samples:
Toolbox | Microarray and Small RNA Analysis (![]() )| General Plots | Create Scatter Plot (
)| General Plots | Create Scatter Plot (![]() )
)
Select two samples ( (![]() ), (
), (![]() ) or (
) or (![]() )). Clicking Next will display a dialog as shown in figure 28.90.
)). Clicking Next will display a dialog as shown in figure 28.90.
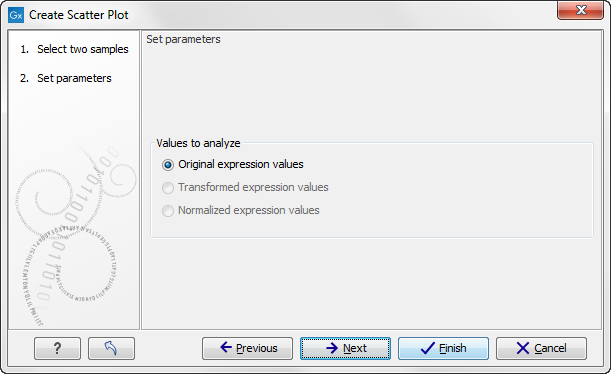
Figure 28.90: Selcting which values the scatter plot should be based on.
In this dialog, you select the values to be used for creating the scatter plot (see Selecting transformed and normalized values for analysis).
Click Finish to start the tool.
For more information about the scatter plot view and how to interpret it, please see Scatter plot view of an experiment.