Running the Coverage analysis tool
To run the Coverage analysis tool:
Toolbox | Resequencing Analysis (![]() ) |
Coverage Analysis (
) |
Coverage Analysis (![]() )
)
This opens the dialog shown in figure 20.66.
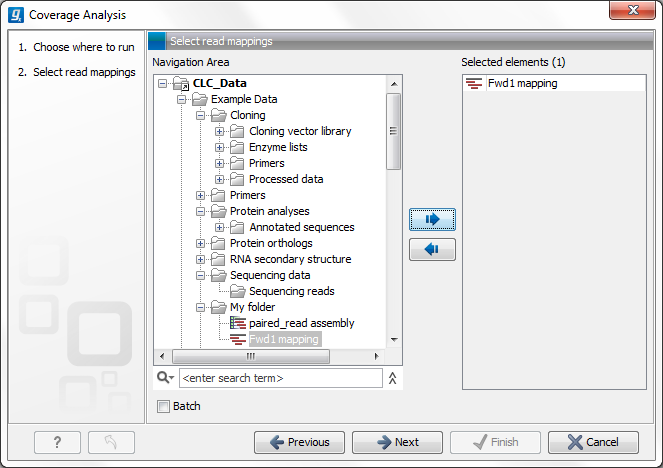
Figure 20.66: Select read mapping results.
Select a reads track or read mapping and click Next. This opens the dialog shown in figure 20.67.
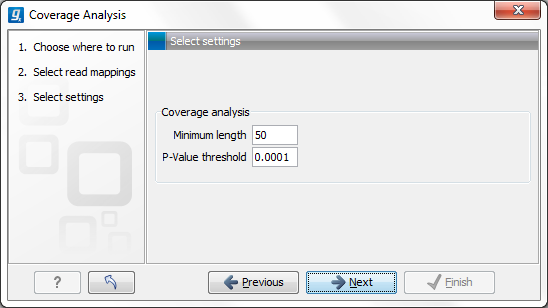
Figure 20.67: Specify the p-value cutoff.
Set the p-value and minimum length cutoff.
Click Next and specify the result handling (figure 20.68). Selecting the "Create regions" will generate the annotation track, while selecting the "Create report" will generate the report described above. Both options are pre-selected by default.
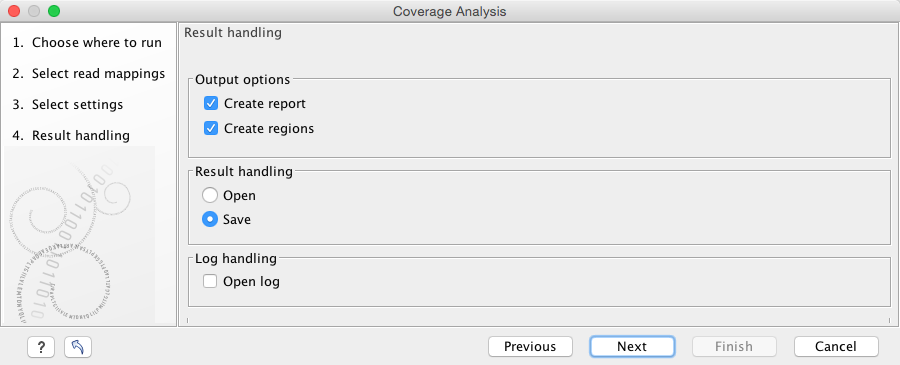
Figure 20.68: Specify the output.
Open or save and click Finish.
An example of a track output of the Coverage analysis tool is shown in figure 20.69.
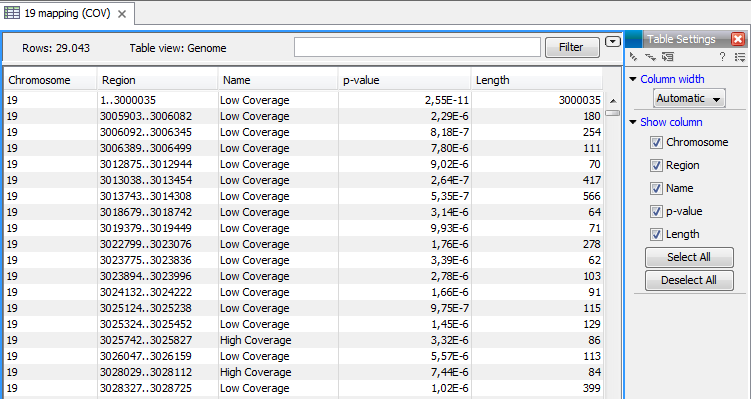
Figure 20.69: An example of a track output of the Coverage analysis tool.
The Coverage Analysis table includes the following columns (figure 20.70):
- Chromosome
- The name is taken from the reference sequence used for mapping
- Region
- The start and end position of this region on the reference sequence
- Name
- The type of annotation: high or low coverage
- P-Value
- The calculated significance p-value for this region
- Length
- The length of the region
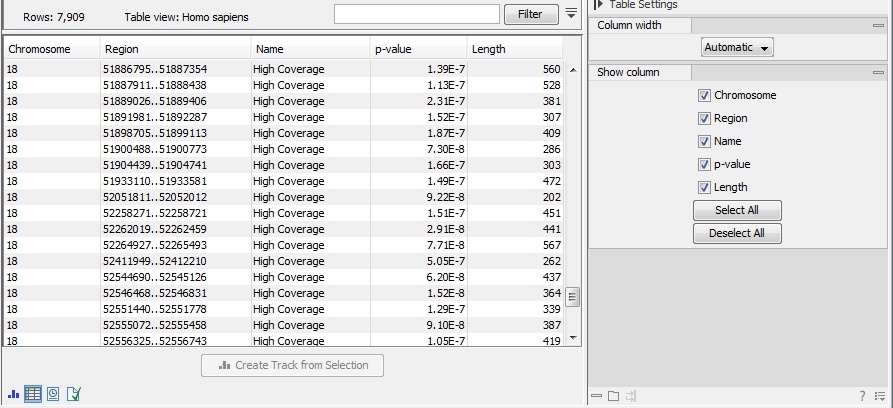
Figure 20.70: The table output with detailed information on each region.
For the visual inspection and comparison to known gene/transcripts or other kind of annotations, all region are also annotated on the read mapping.