Create Mapping Graph
The Create Mapping Graph tool can create a range of different graphs from a read mapping track. To run the tool go to the toolbox:
Toolbox | Genome Browser (![]() ) | Graphs | Create Mapping Graph
) | Graphs | Create Mapping Graph
Select the read mapping as shown in figure 17.21 and click on the button labeled Next.
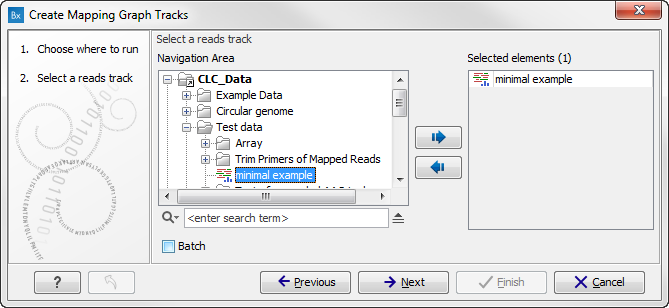
Figure 17.21: Creating graph track from mappings.
Select the graph tracks that you would like to create. The following options exist:
- Read coverage. For each position this graph shows the number of reads contributing to the alignment (see a more elaborate definition in Reference sequence statistics).
- Non-specific read coverage. Non-specific reads are reads that would fit equally well other places in the reference genome.
- Unaligned ends coverage. Un-aligned ends arise when a read has been locally aligned to a reference sequence, and then end of the read is left unaligned because there are mismatches or gaps relative to the reference sequence. This part of the read does not contribute to the read coverage above. The unaligned ends coverage graph shows how many reads that have unaligned ends at each position.
- Non-perfect read coverage. Non-perfect reads are reads with one or more mismatches or gaps relative to the reference sequence.
- Paired read coverage. This lists the coverage of intact pairs. If there are no single reads and no pairs are broken, it will be the same as the standard read coverage above.
- Paired end distance. Displays the average distance between the forward and the reverse read in a pair. A pair contributes to this graph from the beginning of the first read to the end of the second read.
- Broken pair coverage. A pair is broken either because only one read in the pair matches, or because the distance or relative orientation between the reads is wrong.
- Reads start coverage. For each position this graph shows the number of reads that start in that position.
One graph track output will be created for each of the graph tracks you have chosen by checking the boxes shown in figure 17.22.
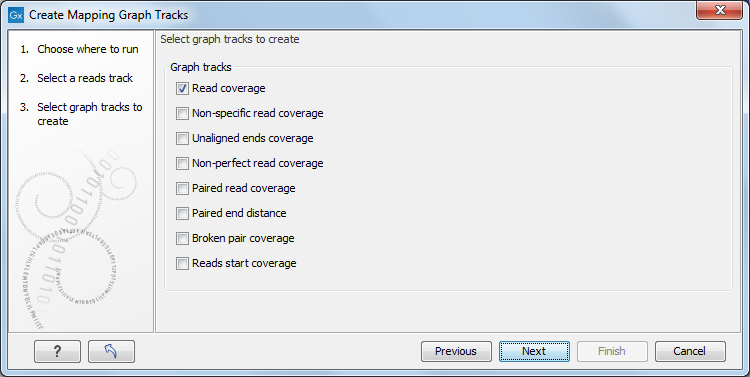
Figure 17.22: Choose the types of graph tracks you would like to generate.
Click on the button labeled Next, choose where to save the generated output(s) and click on the button labeled Finish.
An example of three different outputs is shown in figure 17.23. Two of the views have been dragged and dropped to other areas of the View Area to be able to see them in the same window. If you would like to learn more about how to do this, please refer to Arrange views in View Area.
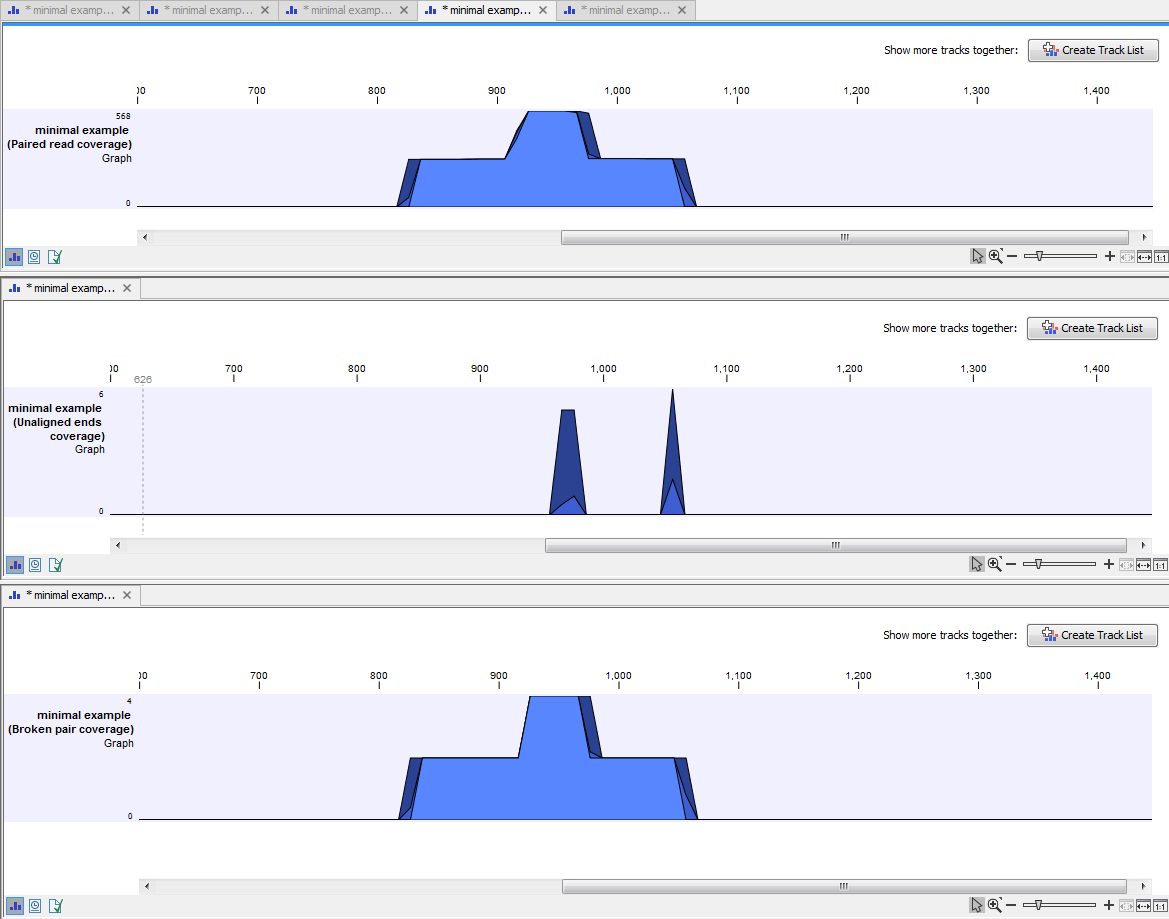
Figure 17.23: Three types of graph tracks are shown.
In this example we generated all possible outputs and chose to open them without saving. You can see that the names of the tabs are marked with an asterisk, which indicates that the graph shown in the view area has not been saved or that changes have been made that must be saved if you want to keep them. Three of the generated outputs have been opened. If you would like to see the outputs in the same view, you can do this by creating a genome browser view. Click on the button labeled Create genome Browser View in the upper right corner of each of the graph tracks shown in the View Area. Combining graph tracks in a genome browser view links the individual tracks together, which makes it much easier to compare the different graph tracks.
Another thing that is worth noting is the options found in the Side Panel. In particular the option "Fix graph bounds" found under Track layout is useful to know if you would like to manually adjust the numbers on the y-axis.