MA plot
The MA plot is a scatter rotated by
You can create an MA plot comparing two samples:
Toolbox | Transcriptomics Analysis (![]() )| General Plots | Create MA Plot (
)| General Plots | Create MA Plot (![]() )
)
Select two samples ( (![]() ), (
), (![]() ) or (
) or (![]() )). Clicking Next will display a dialog as shown in figure 28.103.
)). Clicking Next will display a dialog as shown in figure 28.103.
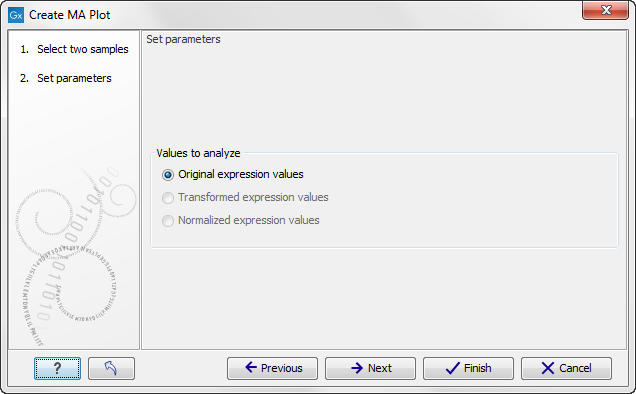
Figure 28.103: Selcting which values the MA plot should be based on.
In this dialog, you select the values to be used for creating the MA plot (see Selecting transformed and normalized values for analysis).
Click Next if you wish to adjust how to
handle the results. If not, click Finish.
Subsections