Output from the Immune Repertoire Analysis tool
Immune Repertoire Analysis produces a TCR clonotypes (![]() ) or BCR clonotypes (
) or BCR clonotypes (![]() ), containing the identified clonotypes, see Clonotypes for more details.
), containing the identified clonotypes, see Clonotypes for more details.
The tool optionally outputs a T cell receptor (TCR) or B cell receptor (BCR) report (![]() ) summarizing statistics of the detected clonotypes. The report includes the following information:
) summarizing statistics of the detected clonotypes. The report includes the following information:
- Summary A summary table containing the number of
- input reads;
- input fragments, where each read pair is counted as one;
- fragments for which a V / J / D / C segment was identified;
- fragments that were successfully clonotyped;
- clonotyped fragments per chain type;
- unique clonotypes before and after merging.
The identification of the segments is performed in the following order:
- Identification is performed first for the V segment.
- Identification is performed for the J segment for fragments where a V segment was identified.
- Identification is performed for the D and C segments for fragments where both a V and J segment was identified.
The remaining information in the report is given per chain type and only for those chain types for which clonotypes have been identified.
Note. All plots can be opened in table view by double-clicking on the plot and clicking on the table icon in the lower left corner.
- Diversity indices. Table containing diversity indices.
As it is likely that some rare clonotypes are missing in the sequencing data,
the extrapolated diversity indices give a projection of how many additional clonotypes there are
and what the diversity would have been if the sample had been sequenced deep enough to capture all clonotypes.
- Total number: The number of different clonotypes detected.
- Extrapolated diversity (chaoE): The extrapolated number of detected clonotypes by the method described in [Chao, 1987].
- Lorenz curve at 50% of total: The percent of clonotypes that account for 50% of the total fragment count. Also sometimes denoted as D50.
- Inverse Simpson's index: Let
 denote the fragment count for the
  th clonotype and let
 .
Then the inverse Simpon's index is defined as:

- Extrapolated Inverse Simpson's index (chaoE): The index by the method described in [Chao et al., 2014].
- Shannon-Wiener index: With
 and
and  defined as above, the Shannon-Wiener index is defined as:

Note that the logarithm is the natural logarithm. To convert to base 2 logarithm the index can be multiplied by

- Extrapolated Shannon-Wiener index (chaoE): The index by the method described in [Chao et al., 2013].
- Rarefaction. A plot for each chain with the rarefaction curve. See Rarefaction For Clonotypes for more details.
- CDR3 length. A plot for each chain showing the length distribution of the CDR3 nucleotide sequences. See CDR3 Lengths For Clonotypes for more details.
- V, D, J and C usage. Histograms for each chain and segment type showing the frequency of each of the detected segments. See Segment Usage For Clonotypes for more details.
Double clicking the plot opens it in a new window.
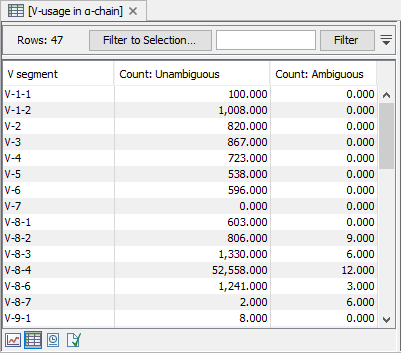
A table view can be selected from the bottom pane, showing counts for all segments, see figure 7.7.

Figure 7.7: A full table showing segment usage can be obtained by double clicking the segment usage plot and selecting table view. - Cumulative frequencies of clonotypes. A plot for each chain showing the cumulative frequencies of the identified clonotypes. See Cumulative Frequencies For Clonotypes for more details.
- Productive summary. The percentage distribution of CDR3 nucleotide sequences that are productive, out-of-frame or contain a premature stop codon
