Target Region Coverage Analysis
The Target Region Coverage Analysis tool makes it easy to evaluate and compare multiple samples with respect to a given coverage metric. The tool takes as input one or more per-region statistics tracks generated by QC for Targeted Sequencing and outputs a target region track providing statistics across the analyzed samples. In addition, an overlay annotation track (for example a gene track) can be provided to obtain a higher-level summary, where target regions are grouped based on overlap, and coverage statistics are calculated for each group.
The QC for Targeted Sequencing tool is described in http://resources.qiagenbioinformatics.com/manuals/clcgenomicsworkbench/current/index.php?manual=QC_Targeted_Sequencing.html.
Running the tool
To launch Target Region Coverage Analysis, go to:
Toolbox | Quality Control (![]() ) | Target Region Coverage Analysis (
) | Target Region Coverage Analysis (![]() )
)
In the first dialog (figure 24.26), select one or more per-region statistic tracks (![]() ) produced by QC for Targeted Sequencing.
The tracks must be based on the same target region track.
) produced by QC for Targeted Sequencing.
The tracks must be based on the same target region track.
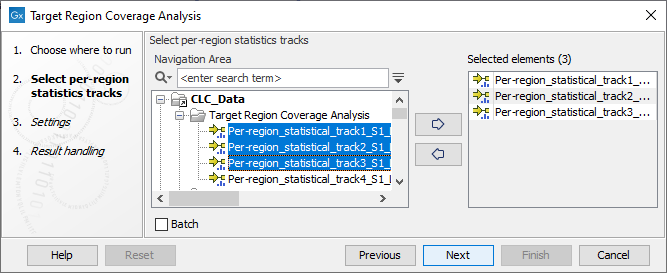
Figure 24.26: Select one or more per-region statistics tracks.
The next dialog allows you to configure the settings for this tool, as shown in figure 24.27 and described below.
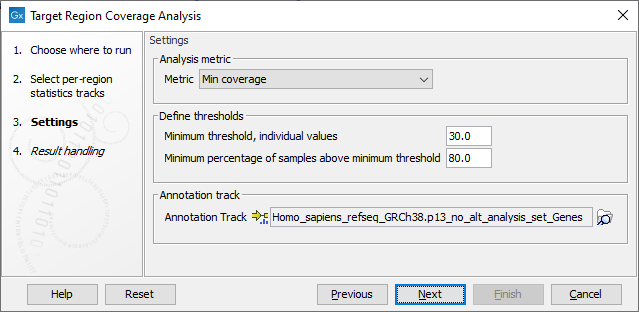
Figure 24.27: Settings of the Target Region Coverage Analysis tool.
- Metric: Metric column from the per-region statistics tracks for which the QC evaluation will be performed. The available metrics are: GC %, Min coverage, Max coverage, Mean coverage, Median coverage, Mean coverage (excluding zero coverage) and Median coverage (excluding zero coverage).
- Minimum threshold, individual values: Minimum threshold for the metric selected above. Each target region in each sample is evaluated separately, and must have at least this value to pass. Values that do not pass this criteria will be highlighted in the table view of the target region output track.
- Minimum percentage of samples above minimum threshold: The percentage of input samples that should pass the minimum threshold. The value is used to color code the target region output track and make it easier to see which target regions that pass the criteria across samples.
- Annotation track: The annotation track (
 ) is optional and can be a gene, CDS or mRNA track. If provided, an additional output is produced in which target regions are grouped based on the overlapping annotations. For example, if a gene track is selected, target regions are grouped per gene and the selected metric is combined and reported per gene.
Subsections