Reads tracks Side Panel settings
The options for the Side Panel vary depending on which track is shown in the View Area. In figure 25.21 an example is shown for a read mapping:
- Navigation.
- The first field gives information about which chromosome is currently shown. The drop-down list can be used to jump to a different chromosome.
- Location indicates the start and end positions of the shown region of the chromosome, but can also be used to navigate the track: enter a range or a single location point to get the visualization to zoom in the region of interest. It is also possible to enter the name of a chromosome (MT: or 5:), the name of a gene or transcript (BRCA" or DHFR-001), or even the range on a particular gene or transcript (BRCA2:122-124)
- The Overview drop-down menu defines what is shown above the track: cytobands, or cytobands with aggregated data (figure 25.20). It can also be hidden all together.
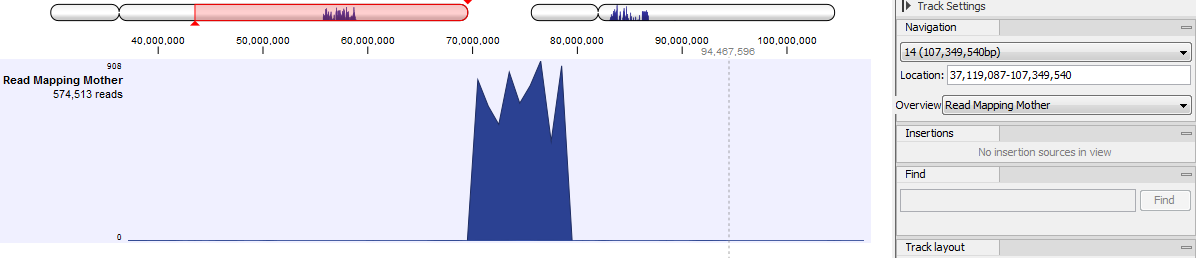
Figure 25.20: Cytobands with aggregated date allows you to navigate easily where needed based on the data location.
- Insertions.
- Only relevant for variant tracks.
- Find.
- Not relevant for reads tracks, as it can only be used to search for annotations in tracks. To search for a sequence, use the Find function in the Side Panel of a stand-alone read mapping.
- Track layout.
- The options for the Track layout varies depending on which track type is shown. The options for a reads track are:
- Data aggregation. Allows you to specify whether the information in the track should be shown in detail or whether you wish to aggregate data. By aggregating data you decrease the detail level but increase the speed of the data display process, which is of particular interest when working with big data sets. The threshold (in bp) for when data should be aggregated can be specified with the drop-down box. The threshold describes the unit (or "bucket") size in base pairs, above which the data will start being aggregated. The bucket size depends on the track length and the zoom level. Hence, a data aggregation threshold with a low value will only show details when zoomed in, whereas a high value means that you can see details even when zoomed out. Please note that when using the high values, it will take longer time to display the data on the screen. Figure 25.21 shows the options for a reads track and an annotation track. The data aggregation settings can be adjusted for each displayed track type.
- Aggregate graph color. Makes it possible to change the graph color.
- Fix maximum of coverage graph. Specifies the maximum coverage to be shown on the y-axis and makes the coverage on individual reads tracks directly comparable with each other. Applies across all of the read mapping tracks.
- Only show coverage graph. When enabled, only the coverage graph is shown and no reads are shown.
- Stack coverage types. Shows read specific coverage graph in layers as opposed as on top of each other.
- Float variant reads to top. When checked, reads with variations will appear at the top of the view.
- Disconnect paired reads. Disconnects paired end reads (see Overlapping Paired Reads).
- Highlight reverse paired reads. When enabled, read pairs with reverse orientation are highlighted with a light blue color.
- Show quality scores. Shows the quality score. Ticking this option makes it possible to adjust the colors of the residues based on their quality scores. A quality score of 20 is used as default and will show all residues with a quality score of 20 or below in a blue color. Residues with quality scores above 20 will have colors that correspond to the selected color code. In this case residues with high quality scores will be shown in reddish colors. Clicking once on the color bar makes it possible to adjust the colors. Double clicking on the slider makes it possible to adjust the quality score limits. In cases where no quality scores are available, blue (the color normally used for residues with a low quality score) is used as default color for such residues.
- Hide insertions below (%). Hides insertions where the percentage of reads containing insertions is below this value. To hide all insertions, set this value to 101.
- Highlight variants. Variants are highlighted
- Matching residues as dots. Replaces matching residues with dots, only variants are shown in letters.
- Reads track legend. Shows the coloring of the mapped reads, and makes it possible to change the coloring of selected reads types.
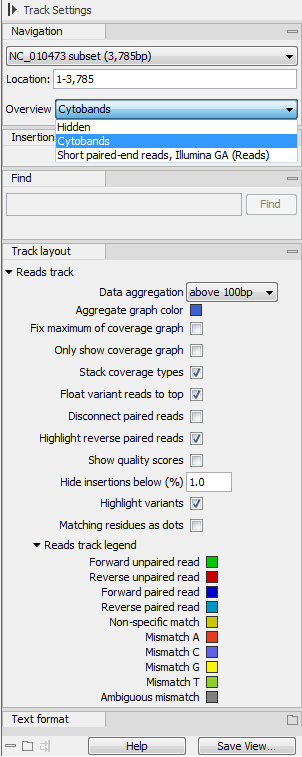
Figure 25.21: The Side Panel for reads tracks.