Create Track from Experiment
The Create Track from Experiment tool in the CLC Genomics Workbench enabled the conversion of experiments to tracks.
You can find the Create Track from Experiment tool here:
Toolbox | Legacy Tools | Create Track from Experiment (![]() ).
).
After you start the tool, you are presented with a wizard where you can choose the experiment that you would like to create a track of. The Create Track from Experiment tool can be run on experiments with associated genomic information, such as those created using expression tracks from the RNA-Seq Analysis tool.
In the case where the experiment has associated genomic information, the Create Track from Experiment tool will automatically infer these and the wizard will jump directly to the filtering step, as shown in figure 33.19.
In the case where the experiment does not have associated genomic information, you will first need to specify how the genomic information should be obtained in the parameters step of the Create Track from Experiment tool (figure 33.18).
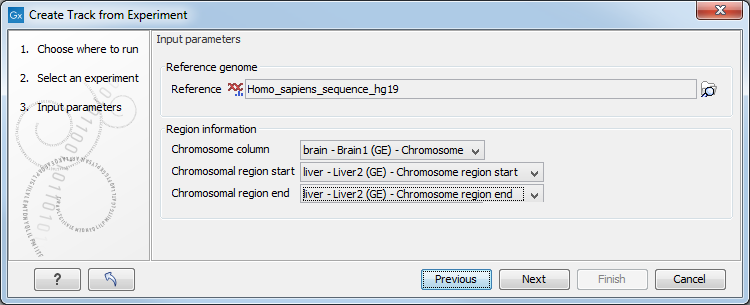
Figure 33.18: The "Input parameters" step in the Create Track from Experiment tool.
In the Input parameters step, you must specify the following parameters:
- Reference genome. The chosen genome will be used as the reference genome for the resulting track.
- Chromosome column. The column containing the chromosome names must be chosen from the drop-down menu.
- Chromosomal region start. The column containing the start of the genomic regions must be chosen from the drop-down menu.
- Chromosomal region end. The column containing the end of the genomic regions must be chosen from the drop-down menu.
Note! The drop-down menus will only contain the columns that potentially represent the information required by the given parameter. If the experiment does not contain any columns that potentially represent the required genomic information, the drop-down menus may appear empty. In this case, it is not possible to convert the given experiment to a track.
In the filtering step (figure 33.19), you have the following options:
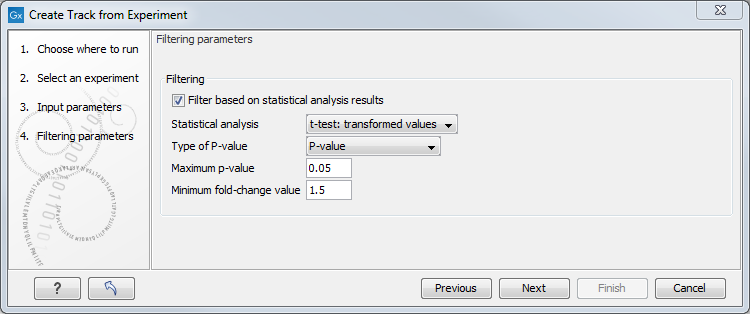
Figure 33.19: The filtering step in the Create Track from Experiment tool.
- Filter based on statistical analysis results This allows to filter which annotations are transferred to the track on the basis of the statistical analysis. To enable filtering, check the Filter based on statistical analysis results checkbox. The filtering option is only available if a statistical analysis has previously been carried out on the experiment, and the drop-down menu will only contain the statistical analyses that are present on the experiment.
- Statistical analysis Allows you to choose statistical analysis from the drop-down list. The selection of available statistical analyses depends on which tests have been used when you set up the experiment that you are about to convert to track format.
- Type of p-value This drop-down menu allows you to select between raw and corrected p-values. Only the types of p-values available for the given statistical analysis will be present in the drop-down menu.
- Maximum p-value In this input field, you can enter the maximum allowed p-value, as a number between 0 and 1. If you do not want any filtering based on p-value, enter 1.
- Minimum fold-change value You can also specify the minimum allowed fold-change value as a number greater than zero. If you do not want any filtering based on fold-change, enter 0.
The fold change values are stored as different columns in the experiment, depending on the statistical analysis performed. The Create Track from Experiment tool will automatically use the fold-change column appropriate for the different statistical analyses:
- Kal's Z-test (see Kal et al.'s test (Z-test)): Proportions fold change.
- Baggerley's test(see Baggerley et al.'s test (Beta-binomial)): Weighted proportions fold change.
- T-test (see T-tests): Fold change.
- ANOVA (see ANOVA): Max fold change.
- Empirical analysis of DGE (see Empirical analysis of DGE): Fold change.
If the chosen statistical analysis was performed on several pairs of groups, there will be an output track for each tested pair of groups. For example, if the same statistical analysis has been carried out on 'group 1 vs. group 2' and 'group 1 vs. group 3', then the output will contain two tracks, where one is filtered according to the 'group 1 vs. group 2' analysis results and the other one is filtered according to the 'group 1 vs. group 3' analysis results.
When running the Create Track from Experiment tool as part of a workflow, there are a few differences in how the parameters are set (see figure 33.20).
- The Source of genomic information parameter determines the behavior of the algorithm if the incoming experiment is not coupled to a genome. If the value of this parameter is set to Require genomic information in experiment, then the algorithm will expect the incoming experiment to be coupled to a genome, and will fail with an error alerting the user in case the experiment does not fulfill this criterion. If the value of the parameter is set to Automatic: use genomic information if available, then the algorithm will still use the genomic information in a genome-coupled experiment. But if this information is not available, the algorithm will attempt to use the information specified by the user in the workflow parameters. Note: If the incoming experiment is coupled to a genome (as will usually be the case), the value of this parameter makes no difference.
- In a workflow setting, the column titles for the chromosome, region end and region start fields can be specified as texts. These fields may be left empty, if the incoming experiment contains the genomic information. If filling out these fields, note that the format for this text is very strict, and must exactly match the text appearing in the drop-down menu when running the tool from the toolbox. For example, if 'Chromosome' is a sample-specific column, for a sample called 'Liver (GE)' in the 'liver' group in the experiment, then the column name text will be: 'liver - Liver (GE) - Chromosome'.
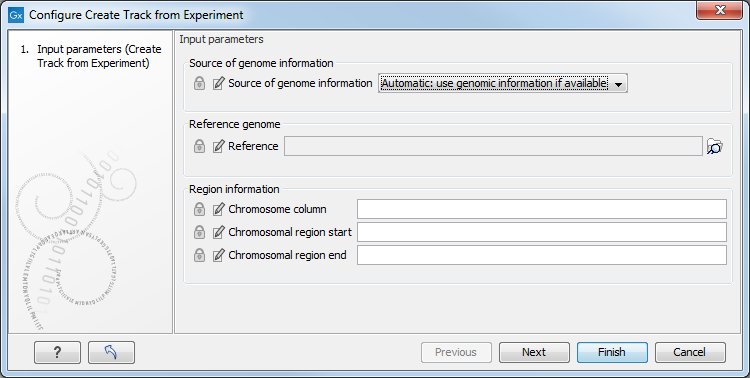
Figure 33.20: Setting the parameters for the Create Track from Experiment tool in a workflow.
The Create Track from Experiment tool will produce a track or several tracks, if filtering based on analysis results was chosen. The track(s) will contain the following annotations:
- All experiment-specific columns from the experiment
- All user-defined annotations added to the experiment
- All analysis-specific columns from the experiment
- All group-specific columns from the experiment
- Those of the following sample-specific columns when present in the experiment (for each sample): Expression values, Total exon reads, and RPKM.
Two different view options exist: the Track List and the Table View. When opening the annotated output result, the default view is the Track List. It is possible to open both views in split view by holding down the Ctrl key while clicking on the table icon in the lower left corner of the View Area. The two different views are linked together. This means that when you click once on an entry in the table, the Track List will jump the selected region. With the Zoom to Selection (![]() ) button it is possible to jump to and zoom in on the selected region (figure 33.21).
) button it is possible to jump to and zoom in on the selected region (figure 33.21).
The results of any statistical test executed on the experiment, including fold-changes and p-values, can be seen in the tooltip when hovering over each region in the annotation track shown in the Track List (figure 33.22).
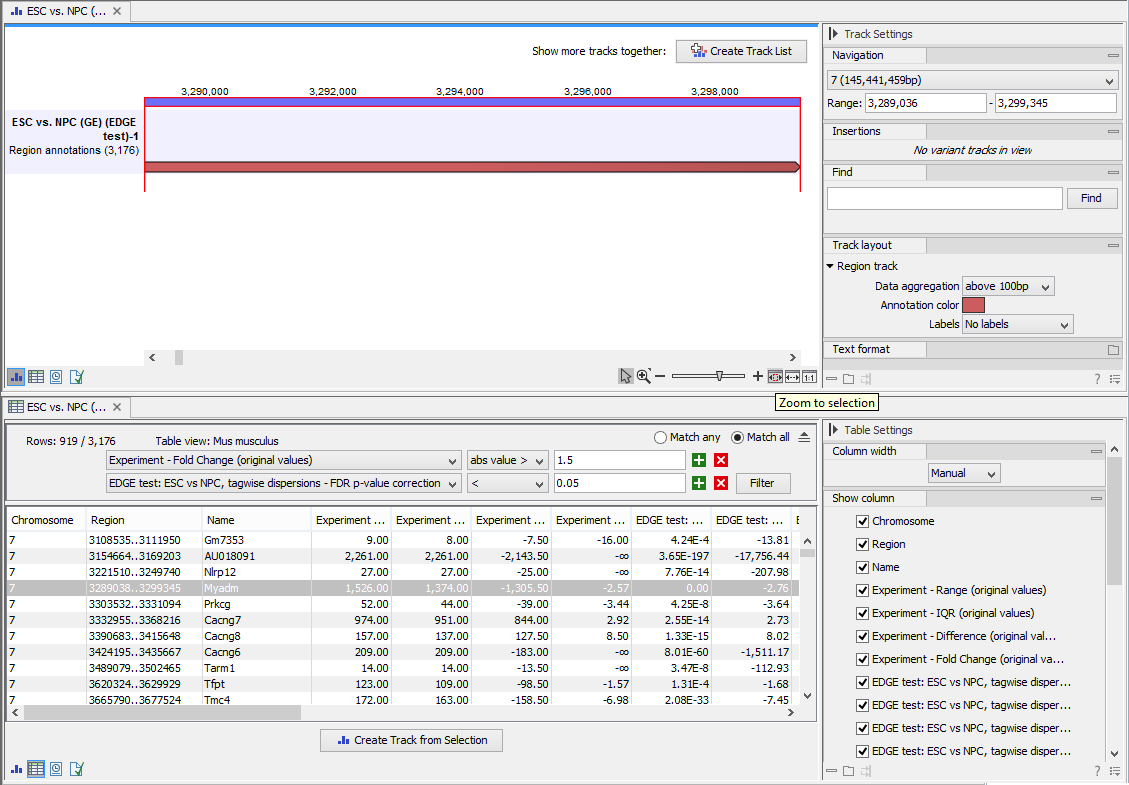
Figure 33.21: Viewing the track produced by the Create Track from Experiment Tool
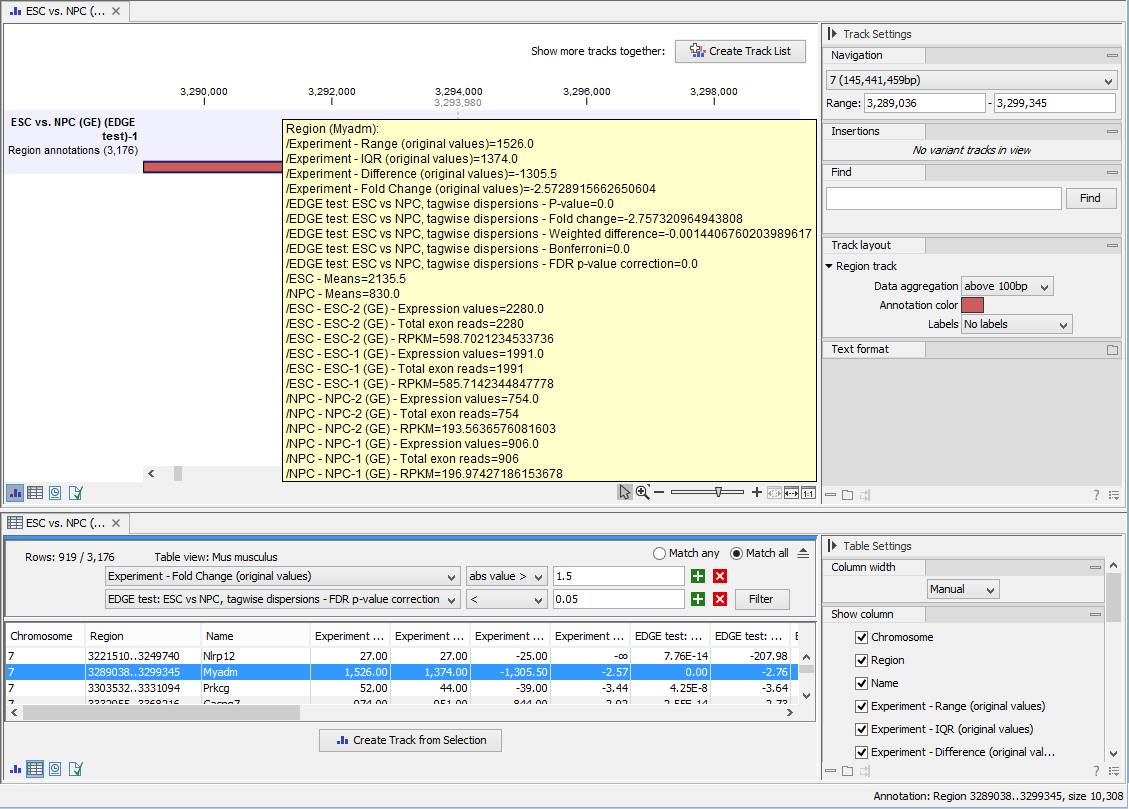
Figure 33.22: The annotations on the track produced by the Create Track from Experiment Tool