Create Mapping Graph
The Create Mapping Graph tool can create a range of different graphs from a read mapping track. To run the tool go to the toolbox:
Toolbox | Track Tools (![]() ) | Graphs | Create Mapping Graph
) | Graphs | Create Mapping Graph
Select the read mapping as shown in figure 23.30 and click on the button labeled Next.
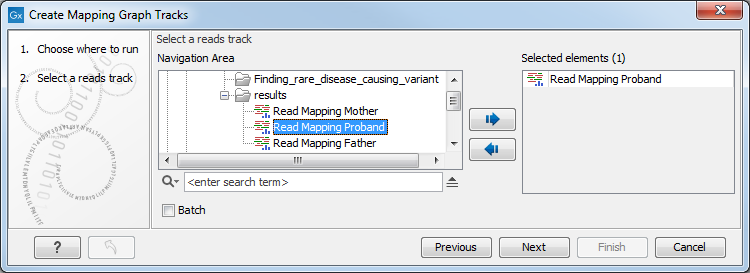
Figure 23.30: Creating graph track from mappings.
Select the graph tracks that you would like to create.
One graph track output will be created for each of the graph tracks you have chosen by checking the boxes shown in figure 23.31.
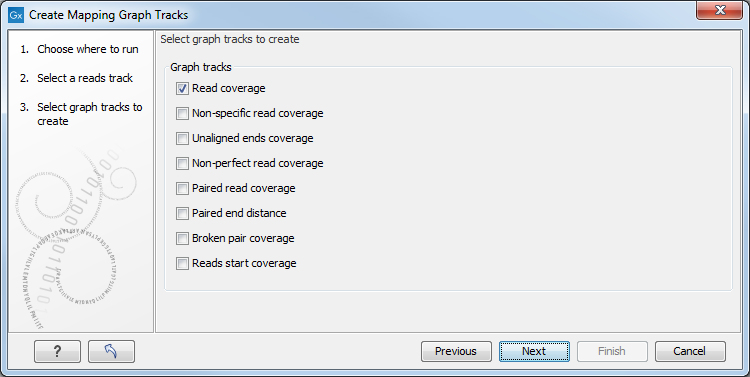
Figure 23.31: Choose the types of graph tracks you would like to generate.
The following options exist:
- Read coverage. For each position this graph shows the number of reads contributing to the alignment (see a more elaborate definition in Reference sequence statistics).
- Non-specific read coverage. Non-specific reads are reads that would fit equally well other places in the reference genome.
- Unaligned ends coverage. Un-aligned ends arise when a read has been locally aligned to a reference sequence, and then end of the read is left unaligned because there are mismatches or gaps relative to the reference sequence. This part of the read does not contribute to the read coverage above. The unaligned ends coverage graph shows how many reads that have unaligned ends at each position.
- Non-perfect read coverage. Non-perfect reads are reads with one or more mismatches or gaps relative to the reference sequence.
- Paired read coverage. This lists the coverage of intact pairs. Coverage is counted as one in the overlapping region.
- Paired end distance. Displays the average distance between the forward and the reverse read in a pair.
- Broken pair coverage. A pair is broken either because only one read in the pair matches, or because the distance or relative orientation between the reads is wrong.
- Reads start coverage. For each position this graph shows the number of reads that start in that position.
Click on the button labeled Next, choose where to save the generated output(s) and click on the button labeled Finish.
An example of three different outputs is shown in figure 23.32.
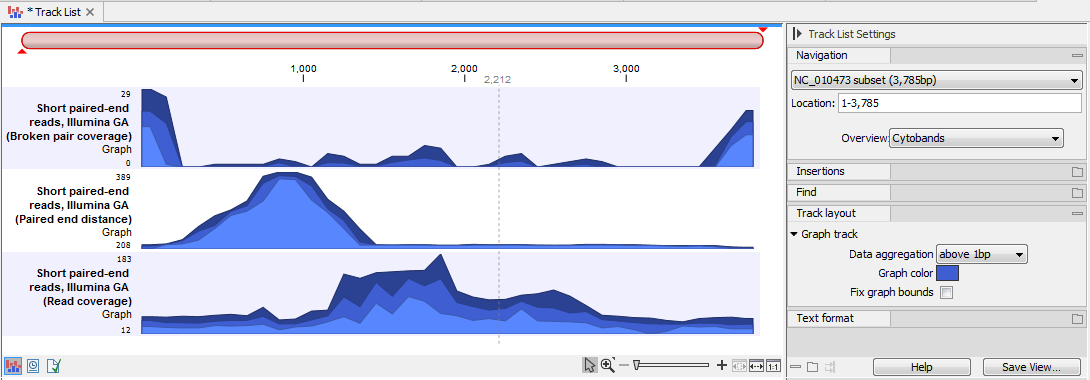
Figure 23.32: Three types of graph tracks are shown.
Note that the option "Fix graph bounds" found under Track layout in the Side Panel is useful to manually adjust the numbers on the y-axis.
When zoomed out, the graph tracks are composed of three curves showing the maximum, mean, and minimum value observed in a given region (see figure 23.35). When zoomed in all the way down to base resolution only one curve will be shown reflecting the exact observation at each individual position (figure 23.33).
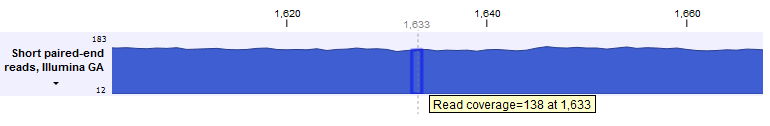
Figure 23.33: A graph track zoomed in.