Output
Clicking Next allows you to specify the output options as shown in figure 3.3.
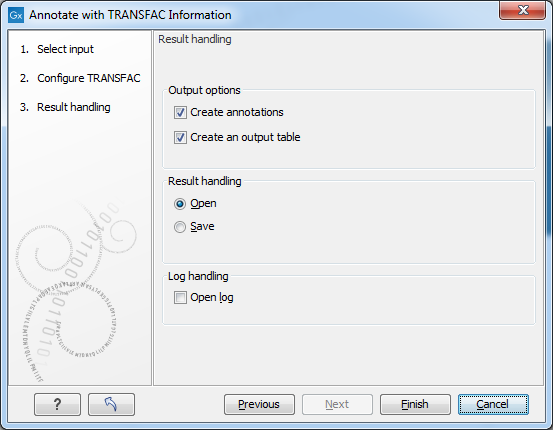
Figure 3.1: Selecting profiles and settings.
Based on the settings in figure 3.2, the Workbench uses the Match program to search for transcription factor binding sites. The binding sites can be reported as annotations that are either added to the input sequences or reported as a track of annotations (depending on the analysis type, Classic or Genomic, see Chapter 3) and/or as an output table as shown in figure 3.4.
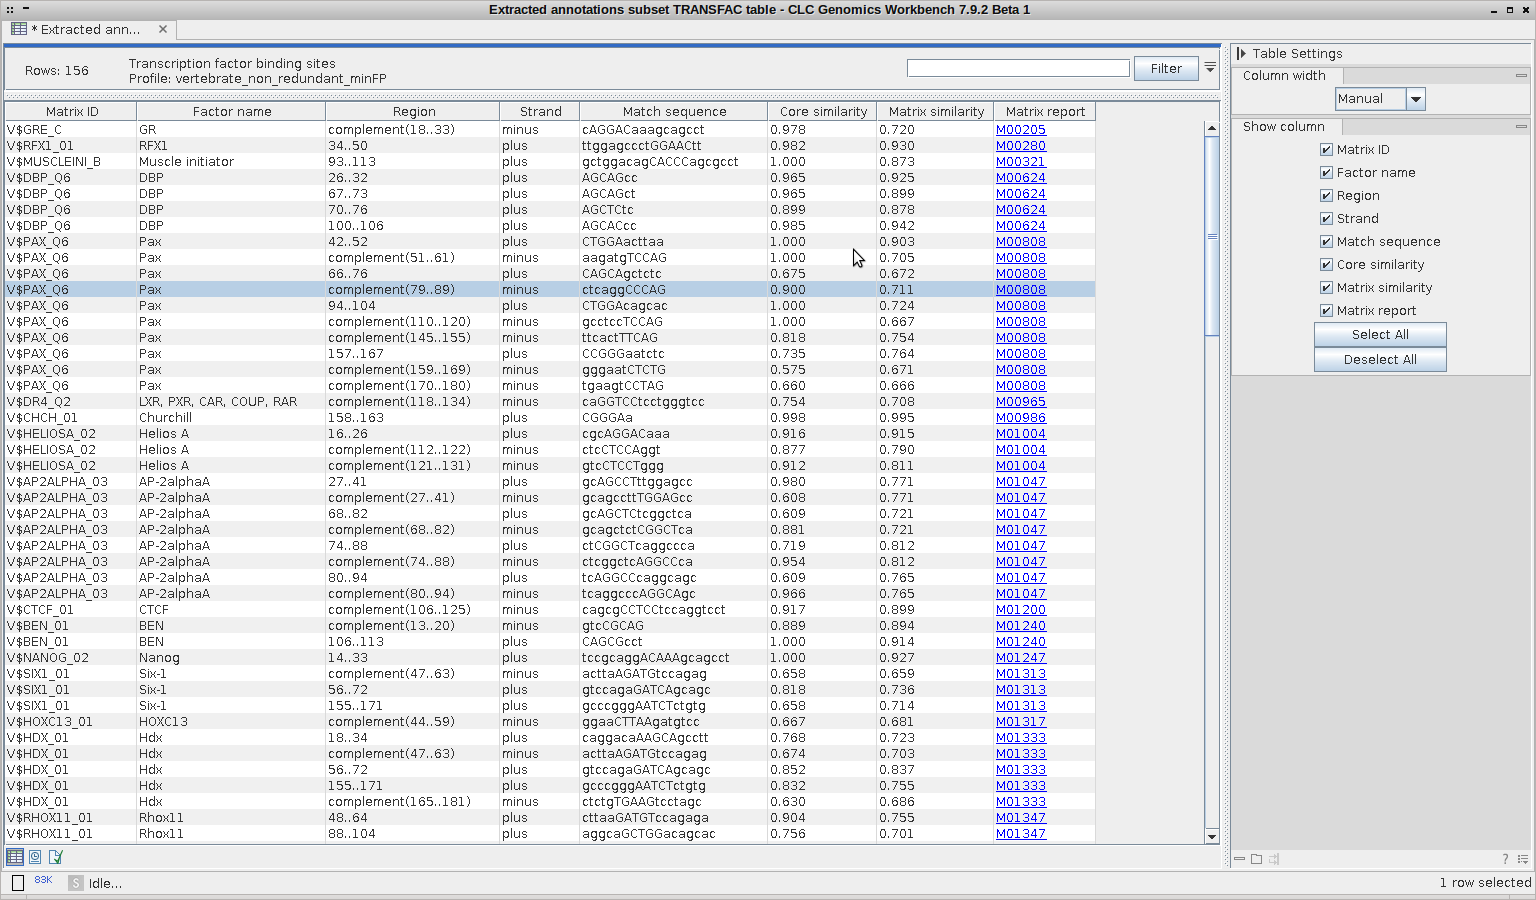
The table includes the following information:
- Matrix ID. Identifier for the matrix with which the putative binding site was found.
- Factor name. Name of the binding factor, represented by the matrix. If a group of factors is assigned to a matrix, only representative factor(s) are given. For a complete list of linked binding factors, please see the Matrix Report in TRANSFAC.
- Region. Position of the matrix match (putative binding site) within the analyzed sequence.
- Strand. Plus/minus. The strand on which the putative site was found depends on the orientation in which the matrix is given in TRANSFAC.
- Match sequence. Shows the matching sequence. Capital letters indicate the positions in the sequence that match with the core sequence of the matrix, while the lower case letters refer to positions that match to the remaining part of the matrix.
- Core similarity. The core similarity score for the matrix match. (The matrix core is defined as the five consecutive most conserved nucleotides within the matrix.)
- Matrix similarity. The matrix similarity score for the matrix match. The Match score can vary from 0 to 1, with 0 for the lowest similarity and 1 for the highest similarity of the match to the matrix. Only those matches are listed in the result, for which the core and matrix similarity are higher than the chosen cut-offs.
- Matrix Report. Matrix accession with a hyperlink to the Matrix Report on the TRANSFAC web page, where you can find details on the matrix and links to its binding factors.