Annotate with TRANSFAC Information
Once the plugin is installed and the preferences have been set, you can start searching for transcription factor binding sites:
Toolbox |
Epigenomics Analysis (![]() ) |
Annotate with TRANSFAC Information (
) |
Annotate with TRANSFAC Information (![]() )
)
or (in Main Workbench):
Toolbox |
Nucleotide Analysis (![]() ) |
Annotate with TRANSFAC Information (
) |
Annotate with TRANSFAC Information (![]() )
)
This opens the wizard, the first step shown in figure 3.1 and explained below.
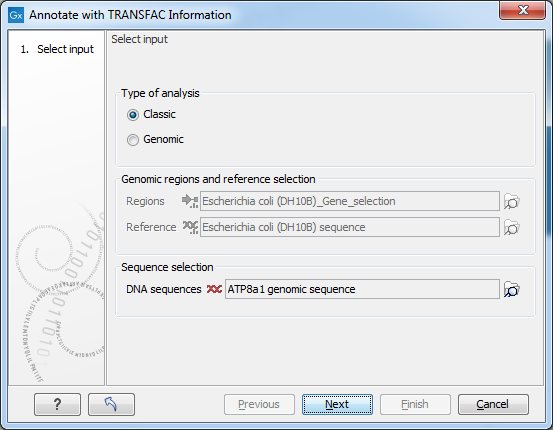
Figure 3.1: Select type of analysis and input data to search for transcription factor binding sites.
Select Input
In this wizard step you specify the input data.- Type of analysis First you need to select between the two modes of the analysis, each explained below.
- Classic This is the legacy mode of analysis where you have raw sequences without genomic information and wish to search for transcription factor binding sites in these sequences.
- Genomic Use this mode if genomic information is available in the form of genomic regions for which you wish to search for transcription factor binding sites. For example, if you have done peak detection from a ChIP-Seq analysis, the regions where peaks are found then are the genomic regions you wish to investigate further.
- Genomic regions and reference selection: This section will be enabled in the Genomic mode of analysis. Data is selected by clicking the corresponding folder icon (
 ) in the right-hand side of the wizard.
- regions: The regions of interest as a track of annotations.
- reference: The reference genome as a track of symbols.
- Sequence selection: This section will be enabled in the Classic mode of analysis. Data is selected by clicking the corresponding folder icon () in the right-hand side of the wizard.
- DNA sequences: The raw DNA sequences of interest.
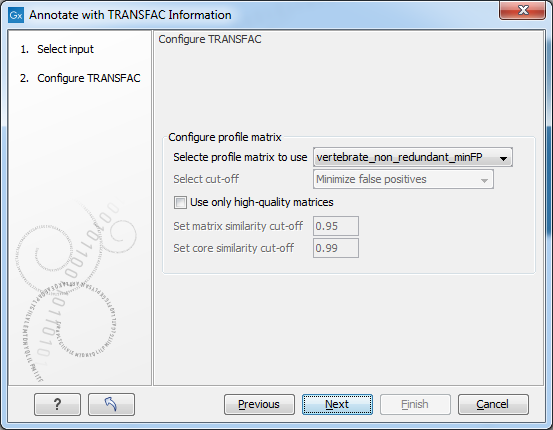
Figure 3.2: Selecting profiles and settings.
Configure TRANSFAC
- Select profile matrix:
- Select profile matrix to use: From the dropdown menu, you specify the profile (set of position weight matrices) for a taxonomic group, tissue, etc. with which you want to scan your sequences/regions for putative transcription factor binding sites. You can also generate your own profiles (matrix sets) in the Match interface of the TRANSFAC online version. During profile generation in Match you are given the option to export/download the profiles. If you place profiles which you generated into the prfs folder of Match of your TRANSFAC flat file download which is used by the TRANSFAC plugin, your profiles will also be available for selection in this dialog box.
- Configure precalculated cut-off: This menu section is only enabled if the 'all' profile was selected.
- Use only high quality matrices: When enabled this will exclude highly abundant matrices which produce at minSUM (see below) more than 10 hits (false positives) per 1000 nucleotides. "High quality matrices" are defined as matrices producing less than 10 hits (FP) per 1000 nucleotides (in sequences, 10.000 to 5.000 nucleotides upstream of the transcription start sites) at minSUM. About 5% of the current matrices producing higher FP rate, can be excluded as "highly abundant" / "low quality"; these 5% of matrices produce about 50% of all FP hits.
- Select cut-off: The combobox has the following options:
- Minimize false positives (minFP). The minFP cut-off can be used to reduce the number of false positives. The false positive rate is estimated by applying the Match algorithm to upstream sequences. The minFP cut-off is defined as the score that gives one percent of hits in the used sequences relative to the number of hits received at the minFN cut-off.
- Minimize false negatives (minFN). The minFN cut-off can be used to reduce the number of false negatives. The false negative rate is measured, as far as available, on known genomic binding sites for the transcription factors. In case not sufficient (less than 10) genomic binding sites are available, SELEX sites or sets of oligonucleotides based on the nucleotide distribution in the weight matrix are used for estimating the minFN cut-off. The minFN cut-off is defined as that score at which at least 90% of the positive test set are recognized, i.e. it equals a false negative rate of 10%.
- Minimize the sum of both error rates (minSUM). The minSUM cut-off can be used to minimize the sum of both error rates. The sum of corresponding percentages for false positives and false negatives is computed for every cut-off ranging from minFN to minFP, whereby the false positive rate at minFN (10% false negative rate) is defined as 100%. The score at which this sum is minimal is used for the minSUM cut-off.
- Configure similarity score thresholds: Here it is possible to further limit the number of matches reported in the results by defining a threshold that is applied to all matches in the results. The similarity score measures the quality of a match (see [Kel et al., 2003] for details). The range is from 0.0 to 1.0 where a score of 1.0 is given to the exact match. Try a more restrictive (higher) setting if you experience running out of memory.
- Define tresholds: This will enable similarity score thresholding.
- Minimum matrix similarity score: The threshold to use for the similarity score computed for the whole matrix.
- Minimum core similarity score: The threshold to use on the similarity score computed only on the core of the matrix (the 5 consecutive positions with highest similarity score).
Subsections