Called Pathways Result
The result of a Identify Pathways run is very similar to the pathway database, see The Pathway Database, in that it has three views:
- The Identified Pathways table (
 )
)
- The Compound table (
 )
)
- The Enzyme table (
 )
)
The Identified Pathways Table
The result of a Identify Pathways run presented as a table where each row corresponds to a pathway with a pathway name, pathway id and for each sample or comparison, depending on whether an abundance table or a differential abundance table has been used, a number of statistics on the pathway call (figure 14.22).
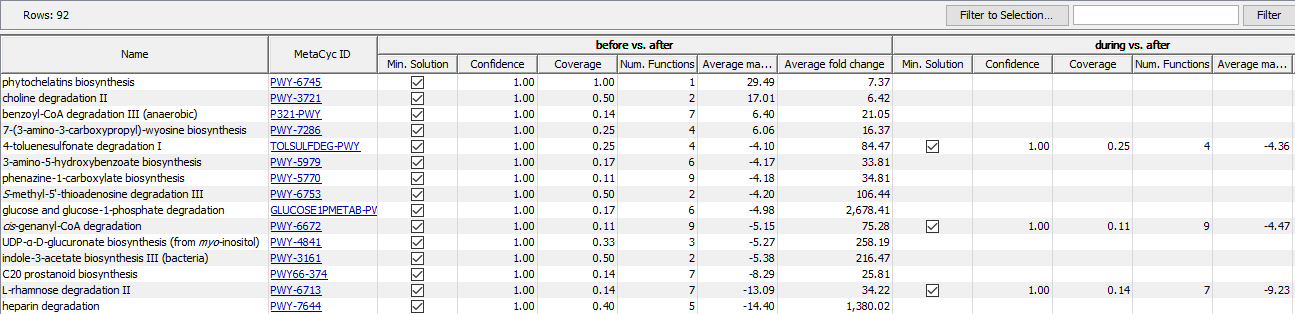
Figure 14.22: The result of the Identify Pathways tool is a table with pathways in the rows and some columns describing the pathway calls for each sample or comparison. Here the result is shown for a differential abundance table.
There are two general columns to describe the pathways that have been called.
- Name: the name of the pathway.
- MetaCyc ID: the MetaCyc ID of the pathway, also a link to the corresponding MetaCyc page.
For each sample or comparison, there are four columns summarizing the result of the pathway calling procedure. Note that empty fields in this table mean that a pathway is not part of any solution for a given sample or comparison.
- Min. Solution: A check mark indicates whether the pathway is part of the minimal solution (see above), an unchecked checkbox means that the pathway is part of the naive solution (see above) and an empty field means that a pathway has not been identified at all.
- Confidence: A confidence score for the pathway to be called, given the EC terms after filtering. If Perform randomization analysis has been selected, the confidence score is calculated as the fraction of randomization experiments in which the pathway occurs. If the aforementioned option was not selected, a simple approximation for this number is given as confidence score. Typically, pathways which are part of the minimal solution also have a high confidence score, but not necessarily.
- Coverage: Reports the fraction of EC terms that have been identified (not filtered) of all EC terms that are present in that pathway.
- Num. Functions: Reports the number of EC terms present in a given pathway.
Depending on whether the input has been an abundance table or a differential abundance table, the result may contain some more columns giving average statistics for the EC terms from the (differential) abundance table for the whole pathway in which they occur. For an abundance table the column Average abundance gives the average abundance for all identified (not-filtered) EC terms that are present in the pathway. Similarly, for a differential abundance table the metrics are summarized by averaging over all identified (not-filtered) EC terms in a pathway, specifically the Average max group mean and Average fold change are reported.