Antigenicity
CLC Main Workbench can help to identify antigenic regions in protein sequences in different ways, using different algorithms. The algorithms provided in the Workbench, merely plot an index of antigenicity over the sequence.
Two different methods are available:
- [Welling et al., 1985] Welling et al. used information on the relative
occurrence of amino acids in antigenic regions to make a scale which
is useful for prediction of antigenic regions. This method is better
than the Hopp-Woods scale of hydrophobicity which is also used to
identify antigenic regions.
- A semi-empirical method for prediction of antigenic regions has been developed [Kolaskar and Tongaonkar, 1990]. This method also includes information of surface accessibility and flexibility and at the time of publication the method was able to predict antigenic determinants with an accuracy of 75%.
Note! Similar results from the two methods can not always be expected as the two methods are based on different training sets.
Displaying the antigenicity for a protein sequence in a plot is done in the following way:
Toolbox | Protein Analysis (![]() )
| Create Antigenicity Plot (
)
| Create Antigenicity Plot (![]() )
)
This opens a dialog. The first step allows you to add or remove sequences. If you had already selected sequences in the Navigation Area before running the Toolbox action, these are shown in the Selected Elements. Clicking Next takes you through to Step 2, which is displayed in figure 17.3.
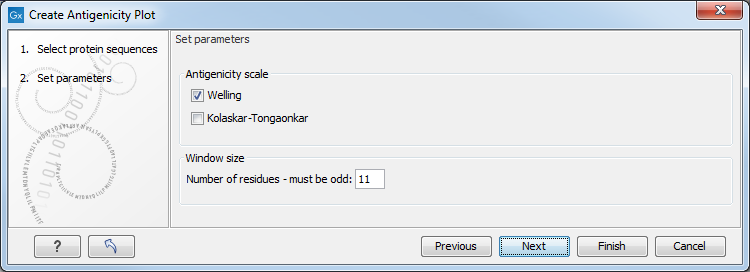
Figure 17.3: Step two in the Antigenicity Plot allows you to choose different antigenicity scales and
the window size.
The Window size is the width of the window where, the antigenicity is calculated. The wider the window, the less volatile the graph. You can chose from a number of antigenicity scales. Click Finish to start the tool. The resultcan be seen in figure 17.4.
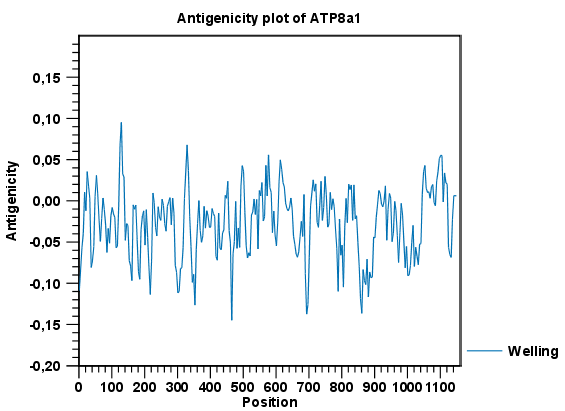
Figure 17.4: The result of the antigenicity plot calculation and the associated
Side Panel.
See Graph preferences for information about the graph view.
The level of antigenicity is calculated on the basis of the different scales. The different scales add different values to each type of amino acid. The antigenicity score is then calculated as the sum of the values in a 'window', which is a particular range of the sequence. The window length can be set from 5 to 25 residues. The wider the window, the less fluctuations in the antigenicity scores.
Antigenicity graphs along the sequence can be displayed using the Side Panel. The functionality is similar to hydrophobicity along the sequence.