QC for Sequencing Reads
Quality assurance as well as concerns regarding sample authenticity in biotechnology and bioengineering have always been serious topics in both production and research. While next generation sequencing techniques greatly enhance in-depth analyses of DNA-samples, they introduce additional error-sources. Resulting error-signatures can neither be easily removed from resulting sequencing data nor necessarily recognized, mainly due to the massive amount of data. Biologists and sequencing facility technicians face not only issues of minor relevance, e.g. suboptimal library preparation, but also serious incidents, including sample-contamination or even mix-ups, ultimately threatening the accuracy of biological conclusions.
While many problems cannot be addressed entirely, QC for Sequencing Reads assists in the quality control process by assessing and visualizing statistics relating to:
- Sequence read lengths and base-coverage
- Nucleotide contributions and base ambiguities
- Quality scores
- Over-represented sequences and hints suggesting contamination events
The inspiration for this tool came from the FastQC-project (http://www.bioinformatics.babraham.ac.uk/projects/fastqc/).
Note that currently, adapter contamination, i.e., adapter sequences in the reads, cannot be detected in a reliable way with this tool. In some cases, adapter contamination will show up as enriched 5-mers near the end of sequences, but only if the contamination is severe.
QC for Sequencing Reads is in the Toolbox at:
Toolbox | Prepare Sequencing Data (![]() ) | QC for Sequencing Reads (
) | QC for Sequencing Reads (![]() )
)
Select one or more sequence lists as input. When multiple sequence lists are selected, they are analyzed together, as a single sample, by default. To generate separate reports for different inputs, check the Batch box below the selection area. More information about running tools in batch mode can be found in Batch processing.
In the "Result handling" wizard step, you can select the reports to generate, and whether you want a sequence list containing potential duplicate sequences to be created.
Two reports can be generated:
- A graphical report This contains plots of the various QC metrics. An example plot is shown in figure 26.1. To support the visualization, end positions with a coverage below 0.005% across the reads are not included. This is because the number of the longest reads in a set may be small, which can result in high variance at the end positions. If such positions are included in the plots, it can make other points hard to see.
- A summary report This contains tables of values for the various QC metrics, as well as general information such as the creation date, the author, the software used, the number of data sets the report is based upon, the data set names, total read number and total number of nucleotides. The maximum number of rows in each table is 500. If there are more than 500 data points, then tables include each read position or length for the first 100 bases, after which a bin range or nth position is used for successive rows.
Each report is divided into sections reporting per-sequence, per-base and over-representation analyses. In the per-sequence analyses, some characteristic (a single value) is assessed for each sequence and then contributes to the overall assessment. In per-base assessments each base position is examined and counted independently. In both these sections, the first items assess the most simple characteristics that are supported by all sequencing technologies while the quality analyses examine quality scores reported from technology-dependent base callers. Please note that the NGS import tools of the CLC Genomics Workbench and CLC Genomics Server convert quality scores to PHRED-scale, regardless of the data source.
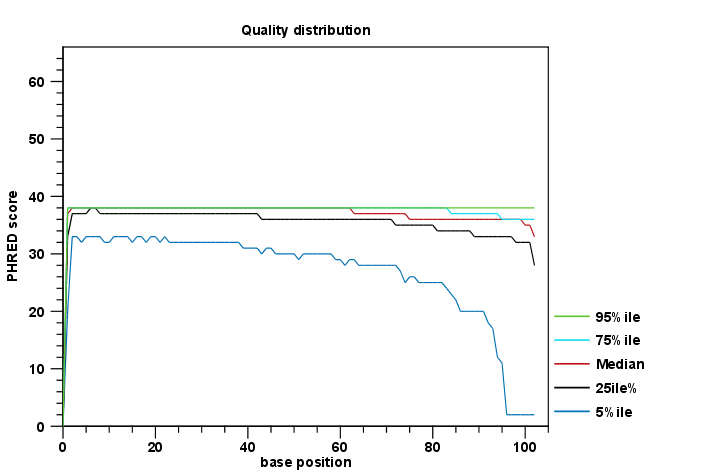
Figure 26.1: An example of a plot from the graphical report, showing the quality values per base position.
Subsections