Quality filters
- Base quality filter: The base quality filter can be used to ignore the reads whose nucleotide at the potential variant position is of dubious quality. This is assessed by considering the quality of the nucleotides in the read in the region around the nucleotide position. There are three parameters to determine the base quality filter:
- Neighborhood radius: This parameter determines the region size: when a neighborhood radius of five is used, each nucleotide in a read is evaluated based on the nucleotides in the read 5 positions upstream and 5 positions downstream of the examined site - a total of 11 nucleotides. (Note that, near the end of the reads, eleven nucleotides are still considered, by changing the region offset relative to the nucleotide in question).
- Minimum central quality: Reads whose central base has a quality below this value are ignored. This parameter does not apply to deletions, since there is no 'central base' in these cases.
- Minimum neighborhood quality: Read for which the minimum quality of the bases within the specified neighborhood radius is below this value, are ignored.
Figure 21.67 gives an example of a variant that is called when the base quality filter is NOT applied, and not called when it is. To understand why it is not called when the base quality filter is applied look at the data in figure 21.68. This figure shows the same data as in figure 21.67, however, now with the 'Show quality scores' option in the side panel of the reads track switched on. This reveals that the reads that carry the potential 'G' variant tend to have poor quality. As all reads that have a base with quality less than 20 in this potential variant position are ignored when the 'Base quality filter' is turned on, no variant is called, most likely because it now does not meet the requirements of either the 'Minimum coverage', 'Minimum count' or 'Minimum frequency' filters. Note that the error in the example shown is a 'typical' Illumina error: the reference has a 'T' that is surrounded by stretches of 'G'. The 'G' signals 'drown' the signal of the 'T'.
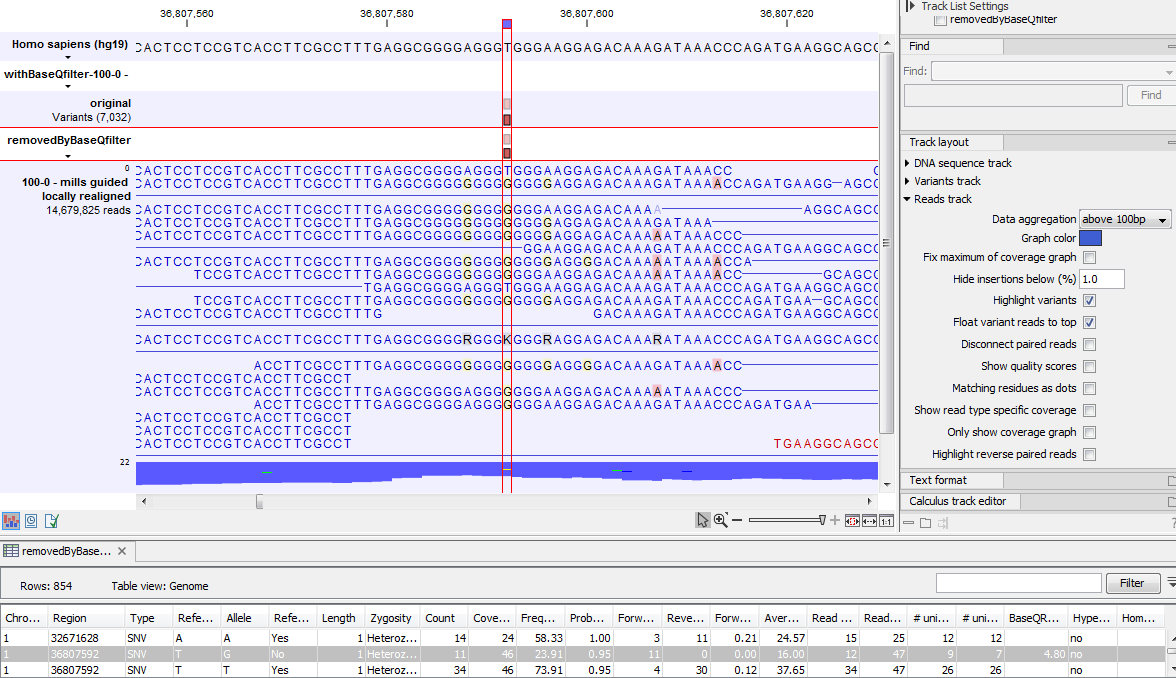
Figure 21.67: An example of a variant that is removed by the base quality filter.
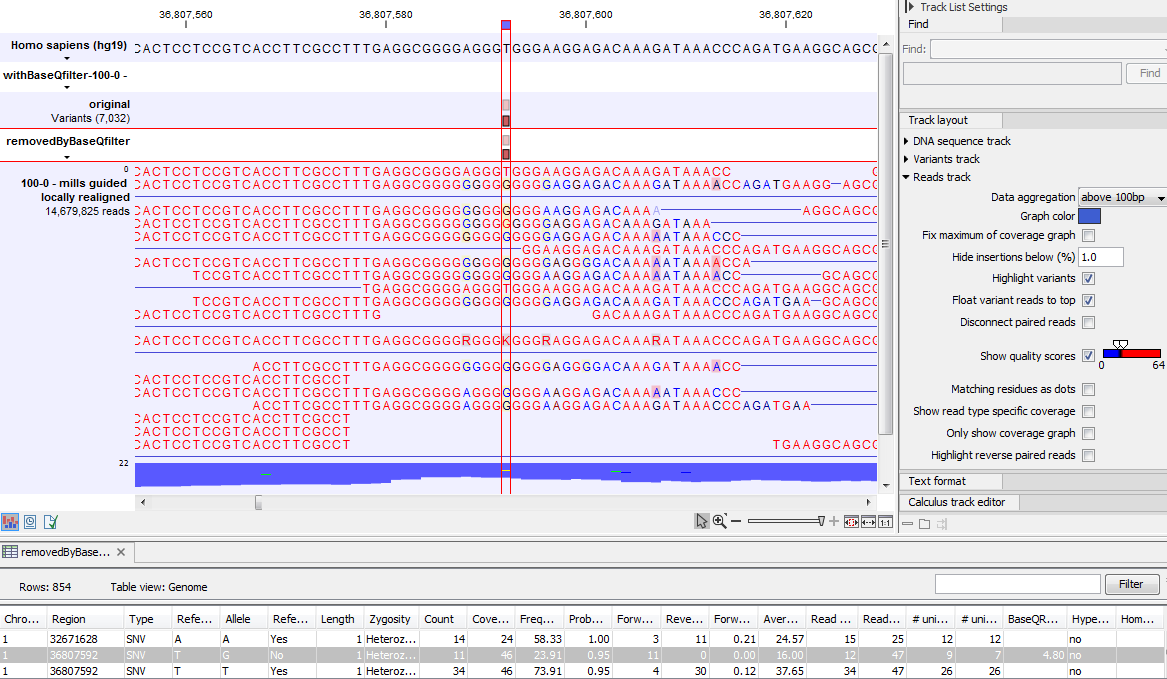
Figure 21.68: The same data as in figure 21.67, now with the 'Show quality scores' option in the reads track switched on.