QC for RNAscan Panels
The QC for RNAscan Panels tool can be found in the Toolbox here:
Tools | QIAseq Panel Expert Tools (![]() ) | QIAseq RNAscan Panel Expert Tools (
) | QIAseq RNAscan Panel Expert Tools (![]() ) | QC for RNAscan Panels (
) | QC for RNAscan Panels (![]() )
)
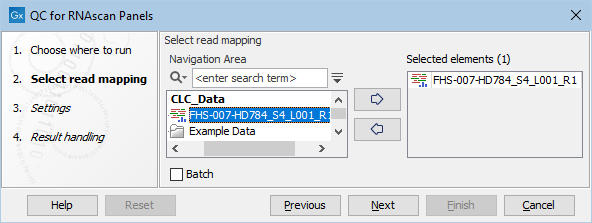
Specify a RNA-seq read mapping as input (figure 7.20).

Figure 7.20: Select a UMI read mapping.
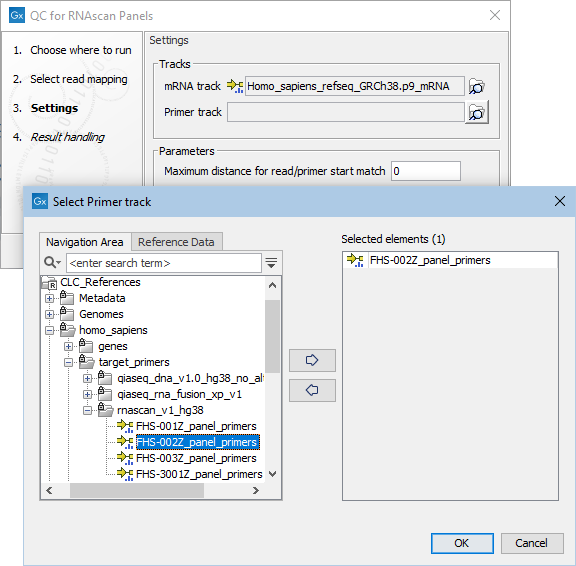
In the next dialog (figure 7.21), specify the mRNA track and the primer track that are saved in the CLC_References folder of the Navigation Area when downloading the QIAseq RNAscan Panels hg38 Reference Data Set. You can also set a maximal distance between a read and a primer start for them to be considered matching. It is set by default to 0, which means that a read will not be considered as starting in the primer unless it maps exactly to the start of the primer.

Figure 7.21: Specify mRNA and primer tracks.
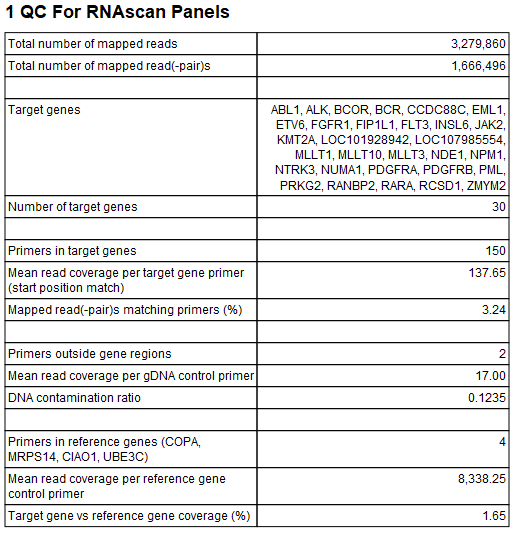
The tool outputs a primer track with annotated read coverage and a report that recapitulates QC data (figure 7.22). The primer track gives information about each primer, as well as its read coverage, and whether it overlaps with target or housekeeping genes.

Figure 7.22: QC for RNAscan Panels report.
The QIAseq RNAscan Panels Report
A QC for RNAscan Panels Report contains the following information:
- Total number of mapped reads: The number of mapped reads, where each individual read is counted, i.e. paired reads are counted as two.
- Total number of mapped reads(-pair)s: The number of mapped reads, where each read pair is counted as one.
- Target genes: The names of the genes targeted by the primers.
- Number of target genes: The number of genes targeted by the primers.
- Primers in target genes: The number of primers within the target gene regions.
- Mean read coverage per target gene primer (start position match): Coverage by reads that start at the primer start site. The value is reported as "-" if the denominator in the calculation, "Primers in target genes", is 0.
- Mapped read(-pair)s matching primers (%). The percentage of read pairs mapping to any kind of primer, including primers in target genes, gDNA control primers, and reference gene control primers. A low value may indicate one or more of the following:
- rRNA contamination
- DNA contamination (estimated separately in this report when gDNA control primers are present)
- The presence of untrimmed adapters before the primer on the read, such that the read does not match the primer within the specified distance threshold
- Over-amplification. Reads from primers are more likely to share a UMI with other reads, and so are more likely to be merged into a single UMI read than off-target reads. Because of this, the percentage of read(-pair)s matching primers will typically decrease after the creation of UMI reads, especially when the average number of reads used to make a UMI read is very high.
- Primers outside gene regions: The number of gDNA control primers outside target gene regions, used for detection of DNA contamination of samples.
- Mean read coverage per gDNA control primer: A value higher than 0 indicates DNA contamination of the sample. A mean coverage of around 50 reads or higher may increase the false positive signal level. This value is reported as "-" if the denominator in the calculation, "Primers outside gene regions", is 0.
- DNA contamination ratio: Calculated as the ratio of "Mean read coverage per gDNA control primer" to "Mean read coverage per target gene primer (start position match)". This value is reported as "-" if any of the values "Primers outside gene regions", "Primers in target genes" or "Mean read coverage per target gene primer (start position match)" is 0. A ratio larger than 1 indicates that the sample contains more DNA than RNA.
- Primers in reference genes (COPA, MRPS14, CIAO1, UBE3C): QIAseq RNAscan panels typically include four reference gene primers.
- Mean read coverage per reference gene control primer: The reference genes should have a mean coverage of at least 300 reads, otherwise the effective input is too low, and false negatives are expected. This value is reported as "-" if the denominator in the calculation, "Primers in reference genes", is 0.
- Target gene versus reference gene coverage (%): Calculated as the ratio of the "Mean read coverage per target gene primer (start position match)" to "Mean read coverage per reference gene control primer", expressed as a percentage. This value is reported as "-" if "Primers in reference genes", "Primers in target genes" or "Mean read coverage per reference gene control primer" is 0.
This report can be used together with the Combine Reports tool (see http://resources.qiagenbioinformatics.com/manuals/clcgenomicsworkbench/current/index.php?manual=Combine_Reports.html)
