Introduction to the Advanced RNA-Seq plugin
The Advanced RNA-Seq plugin provides new tools for statistical analysis and exploratory visualization of RNA-Seq data.The plugin adds four new tools to the RNA-Seq Analysis folder (see figure 1.1).
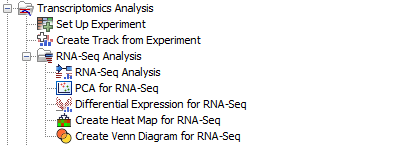
Figure 1.1: The Toolbox with the advanced RNA-Seq tools
The PCA for RNA-Seq tool provides 2D Principal Component Analysis with support for metadata visualization.
The Differential Expression for RNA-Seq tool is a new multi-factorial statistical analysis tool based on a negative binomial model. It uses a generalized linear model approach influenced by the multi-factorial EdgeR method [Robinson et al., 2010]. This tool produces a new kind of result, the statistical comparison track, which can be visualized at specific genomic locations together with other track types. The statistical comparison track also offers a volcano plot view.
The Create Heat Map tool shows a two dimensional heat map of expression values. Each column corresponds to one sample, while each row corresponds to a feature (a gene or a transcript). The samples and features are both clustered hierarchically.
The Create Venn Diagram tool shows the differentially expressed genes shared between statistical comparison tracks. The genes or transcripts considered to be differentially expressed can be controlled by setting appropriate p-value and fold change thresholds.
The Create Expression Browser tool allows expression values for several samples to be compared, together with annotations and statistical comparison tracks.
All of the new tools are designed for, and will only work on, RNA-Seq data (Expression tracks or the new statistical comparison tracks). They also make use of the new, unified metadata framework.
Subsections
- Input data and normalization
- PCA for RNA-Seq
- Differential Expression for RNA-Seq
- Create Heat Map for RNA-Seq
- Create Expression Browser
- Create Venn Diagram for RNA-Seq