SNP tree output report
The Create SNP Tree tool can optionally output a report that summarizes the consequence of the applied filtering settings, as well as a summary of ignored positions attributed to the different read mappings.
The first section of the report, 'Filter Status', contains the actual counts found during analysis. The different categories are described below:
- Number of different input positions corresponds to the number of unique positions based on SNPs (and MNVs if selected).
- Pruned count reflects the number of positions pruned based on the specified filter value (see above).
- Coverage filtered count reflects the number of positions filtered based on the two specified filter values (see above).
- Z-value filtered count reflects the number of positions filtered based on the specified filter value (see above).
- Number of input positions used the final number of positions that passed all filtering steps and used for creating the SNP tree.
The second section consists of a graphical and a tabular representation of the number of positions that was filtered because of the individual read mappings. The tabular view has three columns:
- Read mapping. The name of the read mapping.
- Filtered, total. The total number of filtered positions contributed by this read mapping, i.e. how many positions in this read mapping where either the coverage was too low, or the z-score was too low. Note that several read mappings can contribute the same position.
- Filtered, only by this. The number of filtered positions contributed only by this read mapping, i.e. the number of positions that was filtered by this read mapping, and not filtered by any other read mappings.
| Read mapping | Filtered, total | Filtered, only by this |
| Mapping 1 | 3 | 1 |
| Mapping 2 | 4 | 1 |
| Mapping 3 | 3 | 0 |
Example: Running the Create SNP Tree on the read mappings and variant tracks selected in figures 13.1 and 13.3, we get the report content shown in figures 13.4, 13.5, 13.6 and 13.7.
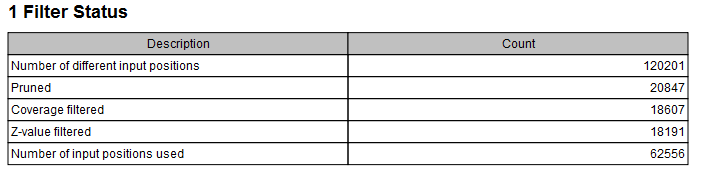
Figure 13.4: Report on Filter Status for the created SNP tree.
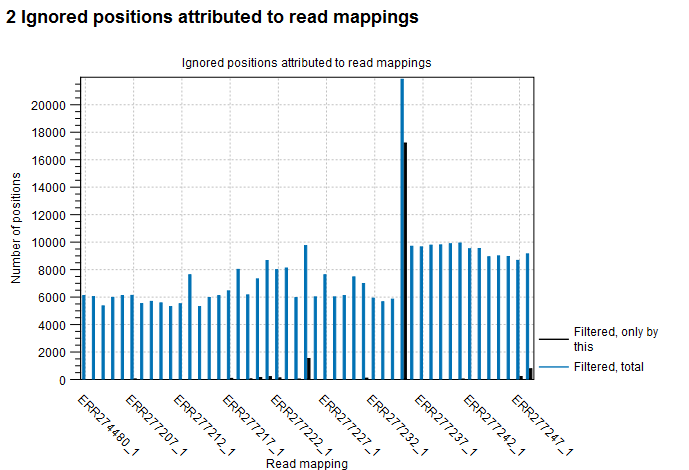
Figure 13.5: Visualization of the filter effect across data used for generation of SNP tree.
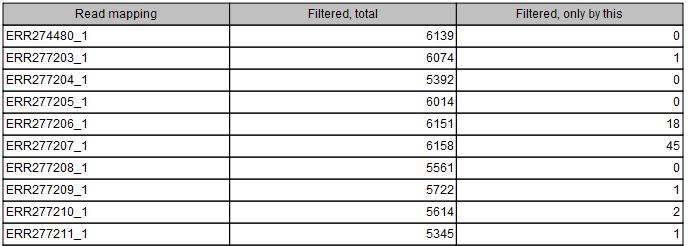
Figure 13.6: Listing filtering results of the first 10 rows of the 47 rows of the data sets. Each row show the number of ignored positions generally across all data set as well as number of ignored positions when filtering on the particular data set only.
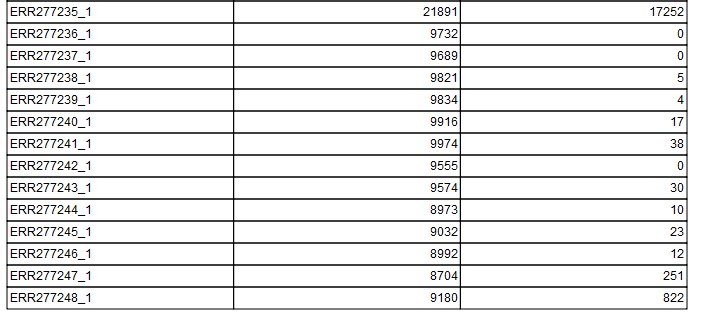
Figure 13.7: Listing filtering results of the last 14 rows of the 47 rows of the data sets. Each row show the number of ignored positions generally across all data set as well as number of ignored positions when filtering on the particular data set only. The tabular information indicates that sample acc no ERR277235_1 shows significantly lower quality than the other samples.
In the applied example, ERR277235_1 shows significantly higher number of positions ignored than the other samples (see figures 13.5 and 13.7), and one might consider rerunning the tree without this sample in an attempt to get a higher resolution in the tree.