QC for Targeted Sequencing
This tool is designed to report the performance (enrichment and specificity) of a targeted re-sequencing experiment. Targeted re-sequencing is due to its low costs, very popular and several companies provide platforms and protocols (learn more at http://en.wikipedia.org/wiki/Exome_sequencing#Target-enrichment_strategies). Array-based approaches are offered by Agilent (SureSelect) and Roche Nimblegen. Furthermore, amplicon sequencing with PCR primers is offered by RainDance, Fluidigm and others.
Given an annotation track with the target regions (for example imported from a bed file), this tool will investigate a read mapping to determine whether the targeted regions have been appropriately covered by sequencing reads. It will also give information about how specific the reads map to the targeted regions. The results are provided both as a summary report and as track or table with detailed information about each targeted region.
Note! This tool is for re-sequencing data only; if you have RNA-seq data, please see RNA-Seq Analysis.
To create the target regions statistics:
Toolbox | Quality Control (![]() ) | QC for Targeted Sequencing (
) | QC for Targeted Sequencing (![]() )
)
This opens a wizard where you can select mapping results (![]() )/ (
)/ (![]() )/ (
)/ (![]() ) as seen in figure 26.1.
) as seen in figure 26.1.
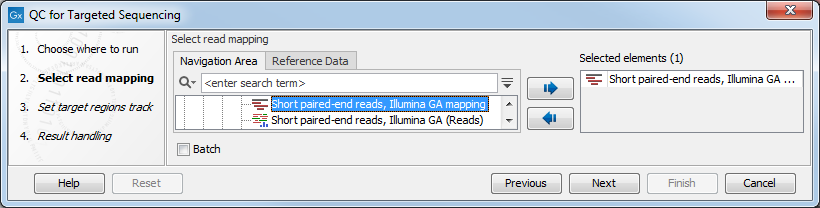
Figure 26.1: Select a read mapping.
Clicking Next will take you to the wizard shown in figure 26.2.
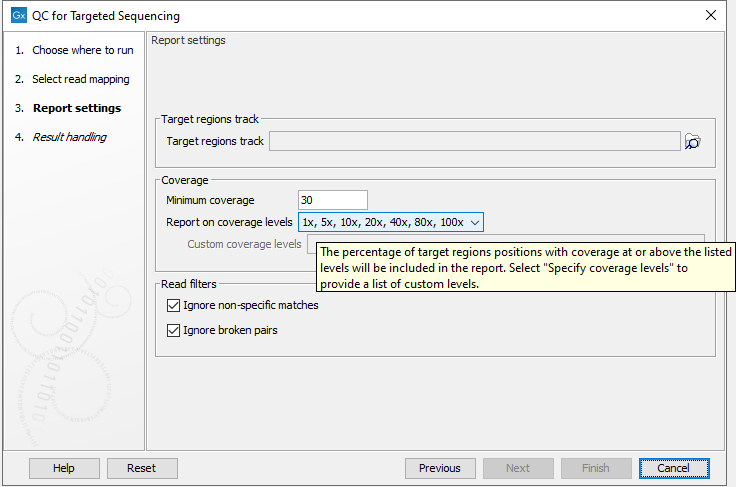
Figure 26.2: Specifying the track of target regions.
Click the Browse (![]() ) icon to select an annotation track that defines the targeted regions of your reference genome.
You can either import the target regions as an annotation file or convert from annotations on a reference genome that is already stored in the Navigation Area.
) icon to select an annotation track that defines the targeted regions of your reference genome.
You can either import the target regions as an annotation file or convert from annotations on a reference genome that is already stored in the Navigation Area.
Under Coverage you can provide a Minimum coverage threshold, i.e., the minimum coverage needed on all positions in a target, in order for that target to be considered covered.
The Report on coverage levels allows you, via a drop-down list, to select different sets of predefined coverage thresholds to use for reporting or to specify you own customized list by selecting Specify coverage levels as shown in figure 26.3. By selecting Specify coverage levels you get the option to add a list of comma-separated custom coverage levels. As shown in figure 26.3 you will get a warning if the Custom coverage levels field is blank and you will not be able to move on to the next wizard step before you have provided custom coverage levels.
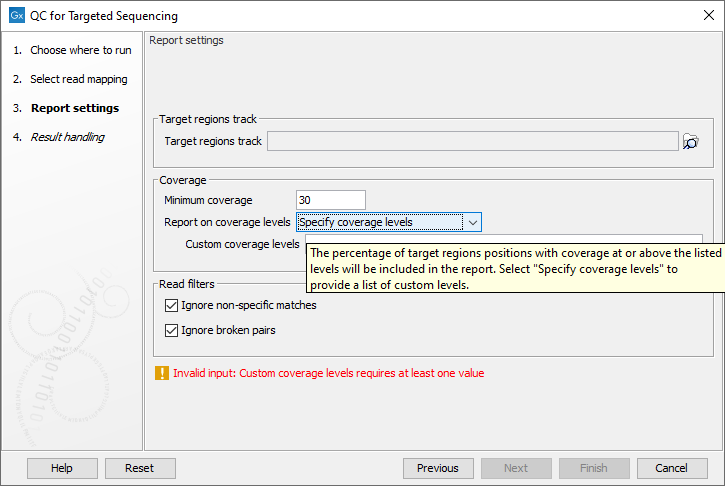
Figure 26.3: Selecting Specify coverage levels from the drop-down list will allow you to add your own custom coverage levels in the text field by typing in the desired coverage levels. Numbers should be comma-separated.
Custom coverage levels must be comma-separated and specified either as plain numbers (20, 30, 40) or in the format 20x, 30x, 40x as shown in figure 26.4.
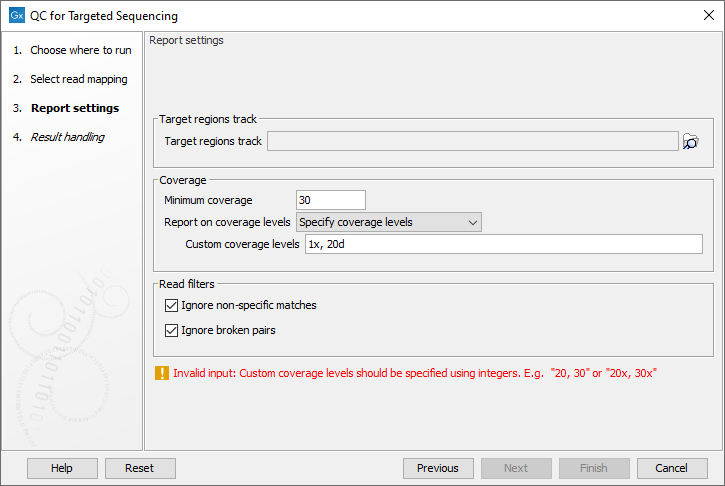
Figure 26.4: When adding a list of custom coverage levels, numbers should be comma-separated and provided in the format 20, 30, 40 or 20x, 30x, 40x.
Finally, you are asked to specify whether you want to Ignore non-specific matches and Ignore broken pairs. When these are applied reads that are non-specifically mapped or belong to broken pairs will be ignored.
Click Next to specify the type of output you want (see figure 26.5).
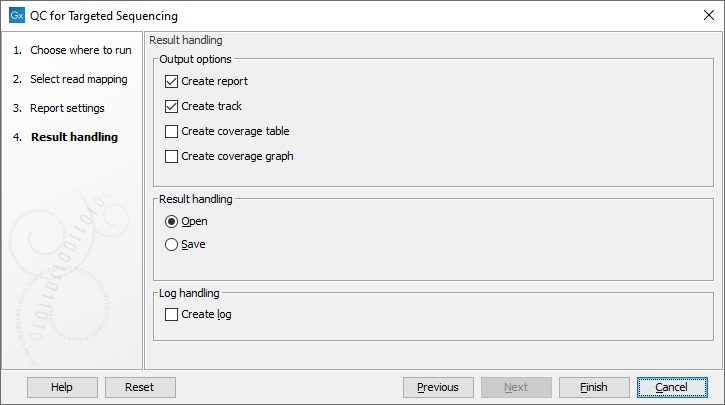
Figure 26.5: Specifying how the result should be reported.
There are three options:
- The report gives an overview of the whole data set as explained in Coverage summary report.
- The track gives information on coverage for each target region as described in Per-region statistics.
- The coverage table outputs coverage for each position in all the targets as described in Coverage table.
- The coverage graph outputs a graphical presentation of the coverage for each position in all the targets. Positions outside the targets will have the value 0. The values are calculated by the "Target regions statistics" tool - that is, where broken pairs and multi-hit reads are included or ignored, depending upon what the user has specified in the wizard. On the x-axis is the reference position; on the y-axis is the coverage. The x-axis and y-axis values are identical to those found in the corresponding columns of the coverage table.
Subsections