Reads tracks
The main advantage of having the output of the read mapping process represented as a track is that this way it seamlessly integrates with other downstream analysis tools. So unless any specific functionality of the stand-alone read mapping is required, we recommend to use the tracks output for the additional flexibility in further analysis. Later it is possible to convert to and from tracks (see Converting data to tracks and back).
When the option "Create reads track" is chosen when running the tool Map Reads to Reference, only the reads themselves will be saved. It is always possible to add information about the reference, consensus sequence or annotations later by creating a Track List.
A reads track will display two types of different information depending on the zooming level at which it is set.
When zoomed out to the point where the amount of data in the view reaches the data aggregation setting, the track shows aggregated mapped reads (figure 27.16), so the height of the graph reflect the coverage of a particular region on the mapping. In addition, three blue shades differentiate from top to bottom:
- The maximum coverage value (read count) of the positions included in that region.
- The average coverage value of the positions included in that region.
- The minimum coverage value of the positions included in that region.
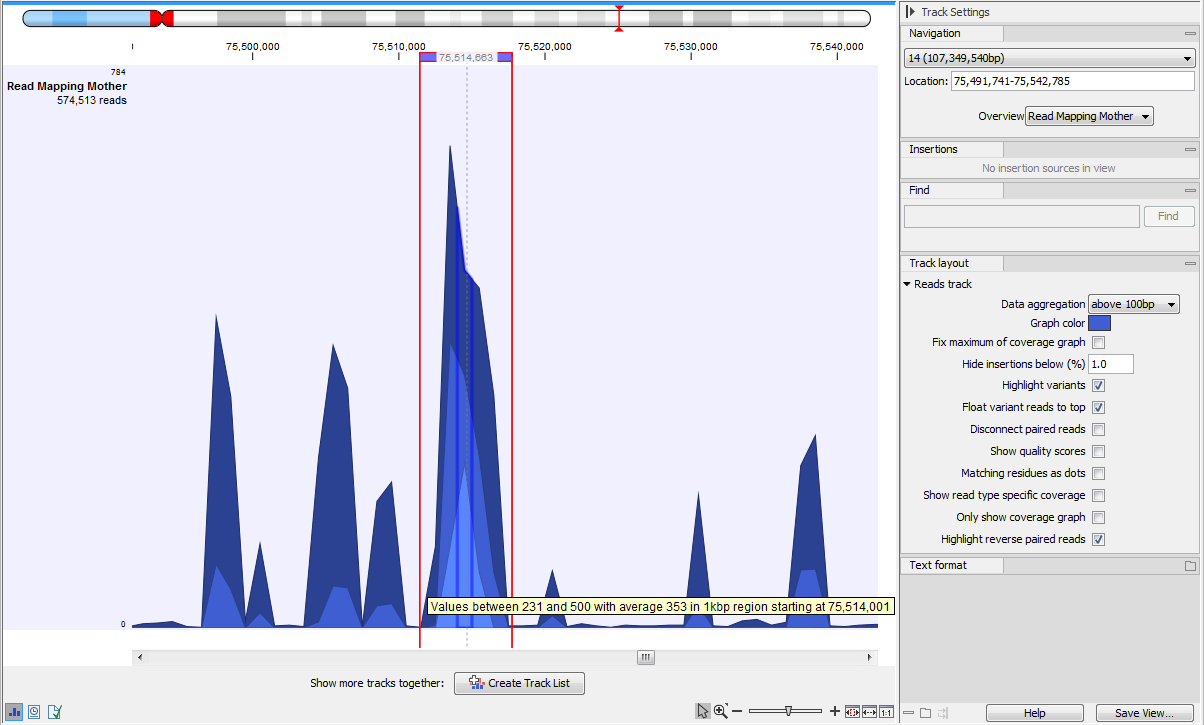
Figure 27.16: In the aggregated Reads Track, the three blue shades represent minimum, average and maximum coverage values for the aggregated mapped reads, here a 1kb region as stated in the tooltip.
The data aggregation view is an alternative way of displaying a large amount of data (mapped reads) on the screen in order to shorten the data display time. This aggregated view allows you to navigate the view more smoothly.
In figure 27.17 we have zoomed in on a reads track displayed in a Track List together with targeted regions and variants annotations shown below.
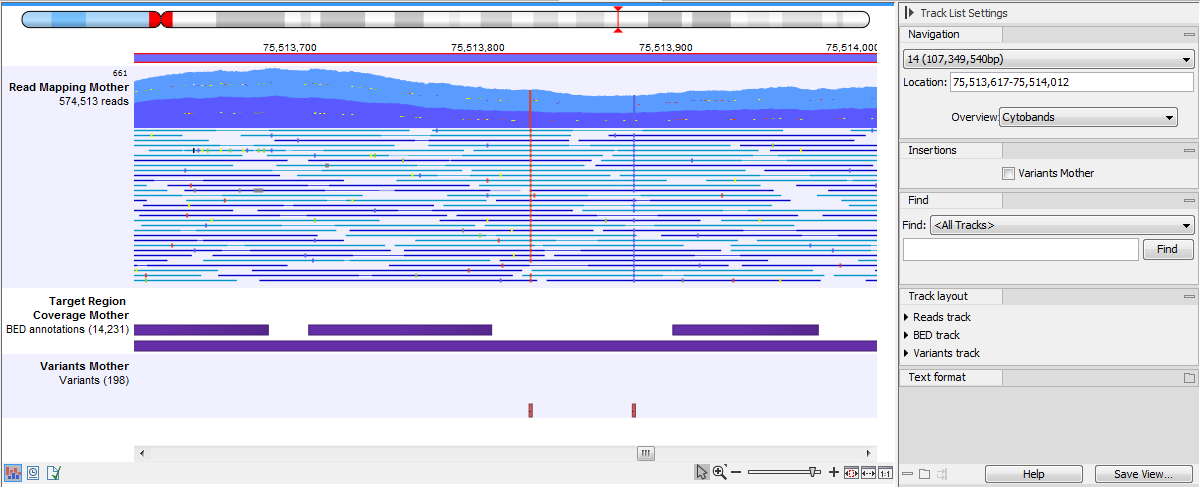
Figure 27.17: Zooming in on the tracks reveals details.
If you zoom in further the alignment of the reads and the reference sequence can be viewed at single nucleotide level (see figure 27.18).
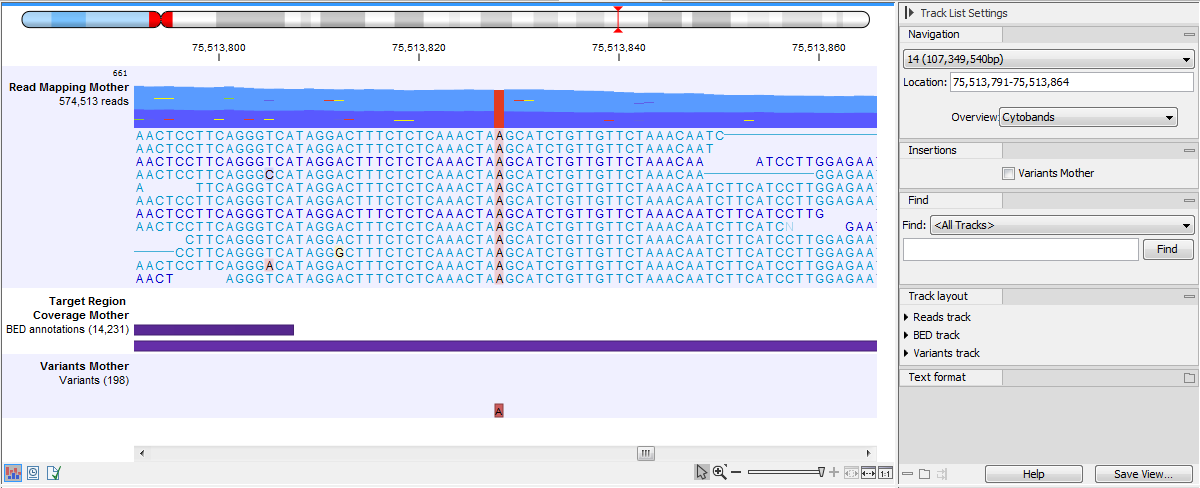
Figure 27.18: Zoom in to see the bases of the reads and the reference sequence.
In this case only a certain amount of reads are visible. In order to see more reads, increase the height of the reads track by dragging down the lower part of the track with the mouse. Also, a vertical scroll bar will appear to the right of the reads when hovering on them to navigate through high coverage regions.
Read mappings to circular genomes, and that map across the starting point of the sequence are shown both at the start and end of the reference sequence. Such reads are marked with » at the end of the read to indicate that the alignment continues at the other end of the reference sequence. Note that it is possible to select a portion of a read and access a right-click menu where you can choose in the Selected Read menu the following options: Copy, BLAST or Open in a New View the selected portion of the read (figure 27.19).
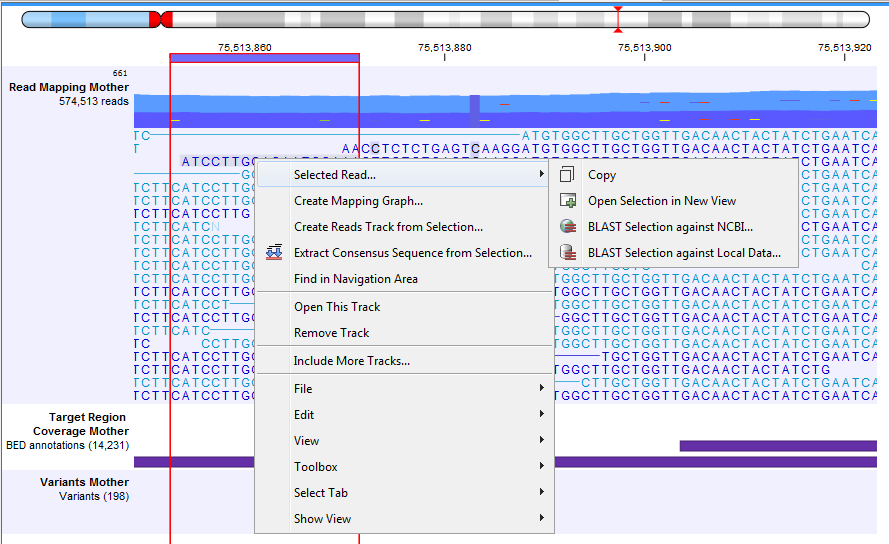
Figure 27.19: Adjusting the height of the track.
When hovering over a position in a Reads track shown in non-aggregated view, a tooltip displays the read counts for each observed nucleotide in that position, together with the directions of the reads with that nucleotide (figure 27.20). Tooltips usually appear after a small wait time once the mouse is on a certain position, but you can hold shift while moving the mouse over the reads to make tooltips appear without any delay.
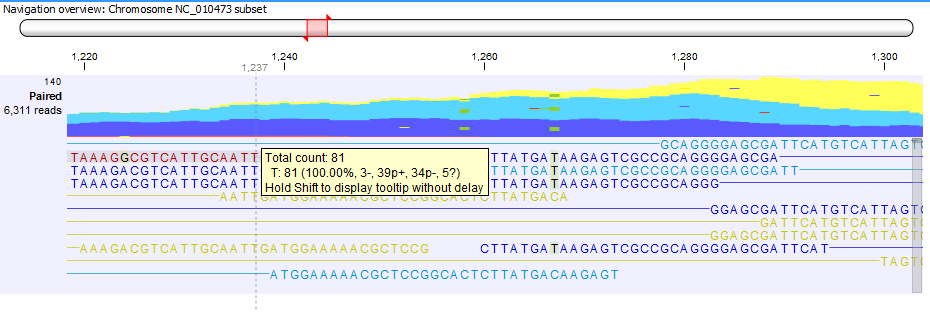
Figure 27.20: Example of a tooltip available in a non aggregated view of a reads track.
The tooltip uses the following symbols for the counts:
- + for single-end read mapped in forward direction, i.e., the number of green reads
- - for single-end read mapped in reverse direction, i.e., the number of red reads
- p+ for paired-end read mapped in forward direction (one count per pair), i.e., the number of dark blue reads
- p- for paired-end read mapped in reverse direction (one count per pair), i.e., the number of light blue reads
- ? for reads mapped in multiple places, i.e., the number of yellow reads
Subsections