Automatic paired distance estimation
The default behavior of the de novo assembler is to use the paired distances provided by the user. If the automatic paired distance estimation is enabled, the assembler will attempt to estimate the distance between paired reads. This is done by analysing the mapping of paired reads to the long unambiguous paths in the graph which are created in the read optimization step described above. The distance estimation algorithm creates a histogram (
We denote the average number of observations in the histogram
![]() where
where ![]() is the number of observations (reads) with distance
is the number of observations (reads) with distance ![]() and
and ![]() is the number of bins in
is the number of bins in ![]() . The gradient of
. The gradient of ![]() at distance
at distance ![]() is denoted
is denoted ![]() . The following algorithm is then used to compute a distance interval for each histogram.
. The following algorithm is then used to compute a distance interval for each histogram.
- Identify peaks in
 as
as
 where
where ![$ [i,j]$](img336.gif) is any interval in where
is any interval in where
 .
.
- For the two largest peaks found, expand the respective intervals to
![$ [k,l]$](img9.gif) where
where
 . I.e. we search for a point in both directions where the number of observations becomes stable. A window of size 5 is used to calculate
  in this step.
- Compute the total number of observations in each of the two expanded intervals.
- If only one peak was found, the corresponding interval is used as the distance estimate unless the peak was at a negative distance in which case no distance estimate is calculated.
- If two peaks were found and the interval for the largest peak contains less than 1% of all observations, the distance is not estimated.
- If two peaks were found and the interval for the largest peak contain
 2X observations compared to the smaller peak, the distance estimate is only computed if one peak was at a positive distance and the other was at a negative distance. If this is the case the interval for the positive peak is used as a distance estimate.
- If two peaks were found and the largest peak has
 2X observations compared to the smaller peak, the interval corresponding to the largest peak is used as the distance estimate.
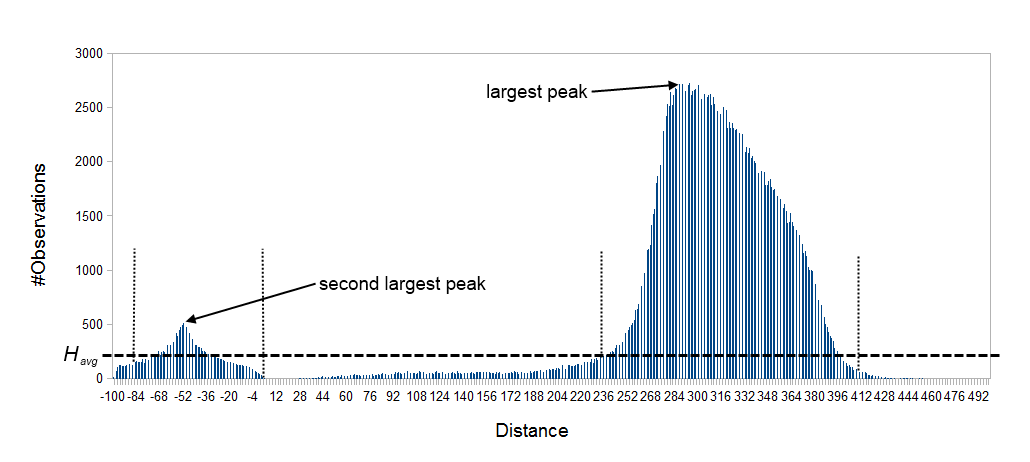
Figure 28.11: Histogram of paired distances where tex2html_wrap_inline$H_avg$ is indicated by the horizontal dashed line. There is two peaks, one is at a negative distance while the other larger peak is at a positive distance. The extended interval tex2html_wrap_inline$[k,l]$ for each peak is indicated by the vertical dotted lines.