Output from the Identify Variants workflow
The "Identify Variants" tool produces six different types of output:
- Structural Variants (
 ) Variant track showing the structural variants; insertions, deletions, replacements. Hold the mouse over one of the variants or right-clicking on the variant. A tooltip will appear with detailed information about the variant. The structural variants can also be viewed in table format by switching to the table view. This is done by pressing the table icon found in the lower left corner of the View Area.
- Structural Variant Report (
 ) The report consists of a number of tables and graphs that in different ways provide information about the structural variants.
- Read Mapping (
 ) The mapped sequencing reads. The reads are shown in different colors depending on their orientation, whether they are single reads or paired reads, and whether they map unambiguously. For the color codes please see the description of sequence colors in the CLC Genomics Workbench manual that can be found here: http://www.clcsupport.com/clcgenomicsworkbench/current/index.php?manual=View_settings_in_Side_Panel.html.
- Read Mapping Report () The report consists of a number of tables and graphs that in different ways provide information about the mapped reads.
- Structural Variants (
 ) A variant track holding the identified variants. The variants can be shown in track format or in table format. When holding the mouse over the detected variants in the Genome Browser view a tooltip appears with information about the individual variants. You will have to zoom in on the variants to be able to see the detailed tooltip.
- Genome Browser View Identify Variants (
 ) A collection of tracks presented together. Shows the annotated variants track together with the human reference sequence, genes, transcripts, coding regions, the mapped reads, the identified variants, and the structural variants (see figure 12.10).
Before looking at the identified variants, we recommend that you first take a look at the mapping report to see whether the coverage is sufficient in the regions of interest (e.g. > 30 ). Furthermore, please check that at least 90% of the reads map to the human reference sequence. In case of a targeted experiment, please also check that the majority of reads map to the targeted region.
Next, open the Genome Browser View file (see figure 12.5).
The Genome Browser View lists the track of the identified variants in context to the human reference sequence, genes, transcripts, coding regions, and mapped sequencing reads.
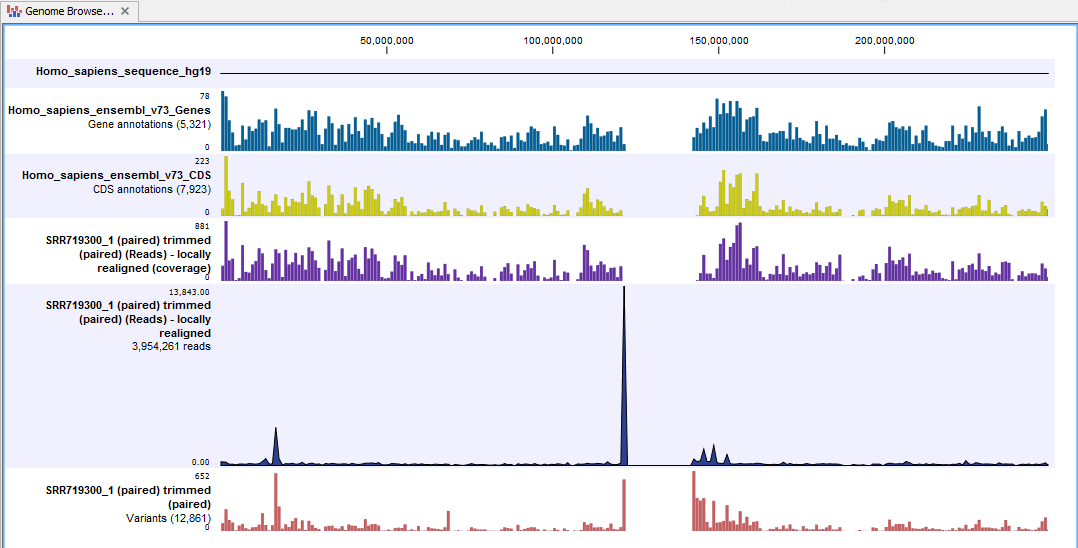
Figure 12.5: The Genome Browser View allows easy inspection of the identified smaller variants, larger insertions and deletions, and structural variants in the
context of the human genome.
By double-clicking on the InDel variant track in the Genome Browser View, a table will be shown that lists all identified larger insertions and deletions (see figure 12.6).
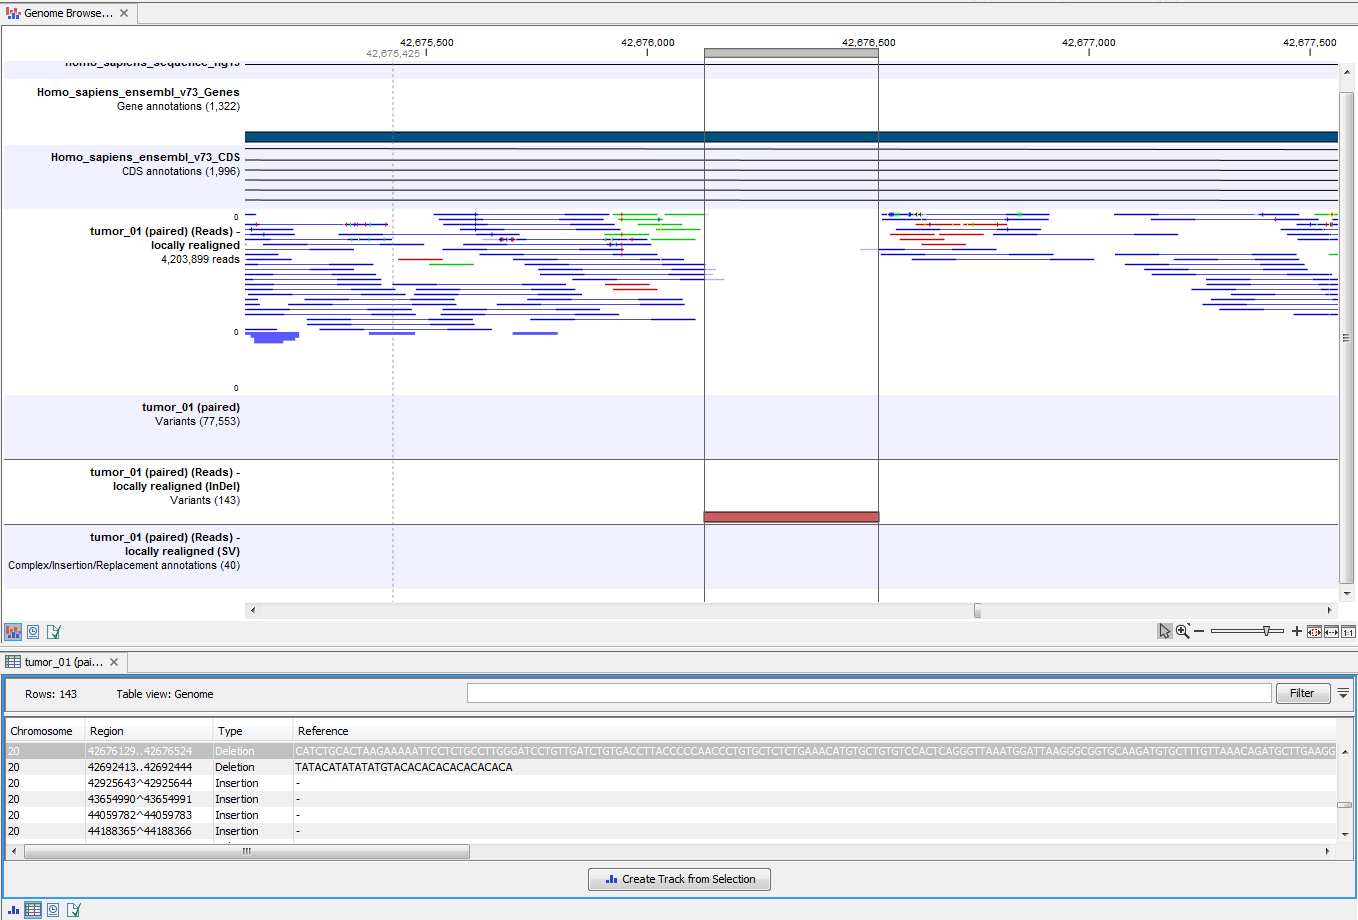
Figure 12.6: This figure shows a Genome Browser View with an open track table. The table allows deeper inspection of the identified variants.
In case you would like to change the reference sequence used for read mapping or the human genes, please use the "Data Management" (see Download and configure reference data).