Uploading data to IPA using the Pathway Analysis tool
Launch the Pathway Analysis tool from the toolbox:
Toolbox | Ingenuity Pathway Analysis | Pathway Analysis
Use one or several statistical comparison(s) as input (![]() ) (figure 2.1), and click Next.
) (figure 2.1), and click Next.
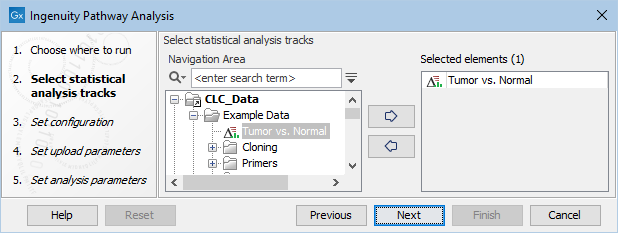
Figure 2.1: Select at least one statistical comparison to analyze.
Under Set configuration (figure 2.2), you get the following options:
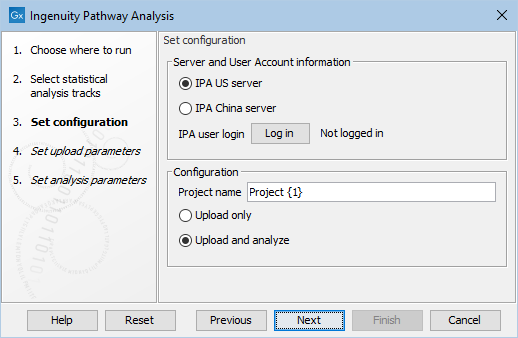
Figure 2.2: Configure the tool to upload and potentially analyze the statistical comparison data in IPA.
- IPA server location
- Select the IPA server relevant for your account.
- IPA user login
- Click the Log in button to open a new browser (or new tab) where you can log in. This gives the workbench permission to upload data to IPA on your behalf.
- Project Name
- This will be the name of the project in IPA once created. {1} will be substituted with a date stamp. It is also possible to create a custom project name by typing in the desired name in this field.
- Upload only / Upload and analyse
- Select "Upload only", if you only wish to create a dataset in IPA. Select "Upload and analyse", if you want to create an analysis from the dataset as well.
Click Next to go to the next wizard step (figure 2.3).
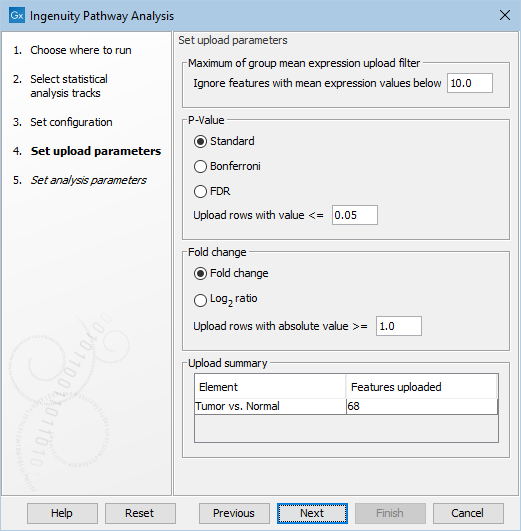
Figure 2.3: Configure the parameters for uploading the data to IPA.
In this wizard step, the cutoff values for what should be uploaded to IPA can be specified. Only features that pass the cutoffs that have been specified at this step will be sent to IPA and be part of the dataset that can be seen in IPA.
Under Set upload parameters you get the following options:
- Ignore features with mean expression values below
- This value is used to filter genes/transcripts before uploading them to IPA. Features with 'Max group mean' values below this limit will not be uploaded.
- Upload rows with value <=
- Maximum p-value for feature (gene or transcript) to be uploaded. Features with a p-value above this number will not be uploaded. It is possible to choose between different types of p-Values: Standard, Bonferroni, and FDR. Note that when a feature has a standard p-Value but a missing Bonferroni or FDR p-Value, then these missing p-Values will be set to 1.0.
- Upload rows with absolute value >=
- Minimum absolute fold change for feature to be uploaded. Features with a fold change/log2 ratio below this number will not be uploaded. It is possible to choose between different types of fold changes: Fold change, and log
 -ratio.
- Upload Summary
- This summary shows how many features the tool will upload to IPA for each statistical comparison. The values are updated, when the user changes any of the upload parameters. In this way, the user can easily check the effect of the filtering (for instance to avoid setting the filters such that no features will be uploaded)
If you had selected "Upload only" in the first step, click Finish to start the tool. But if you had selected "Upload and analyze", click Next to see the dialog shown in figure 2.4.
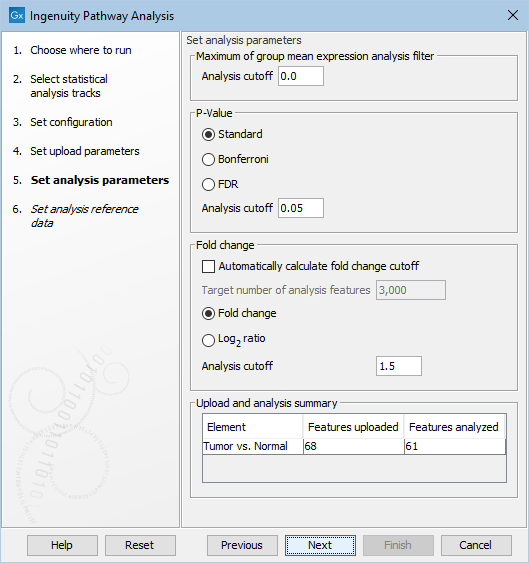
Figure 2.4: Set the parameters for the analysis of the data in IPA.
Under Set analysis parameters, you get the following options:
- Maximum of group mean expression analysis filter | Analysis cutoff
- Minimum group mean expression value for feature (gene or transcript) to be used in analysis. Features with a group mean expression value below this number will be uploaded, but will be ignored in the analysis.
- p-Value | Analysis cutoff
- Maximum p-value for feature (gene or transcript) to be used in analysis. Features with a p-value above this number will be uploaded, but will be ignored in the analysis. It is possible to choose between different types of p-values: Standard, Bonferroni, and FDR. Note that when a feature has a standard p-Value but a missing Bonferroni or FDR p-Value, then these missing p-Values will be set to 1.0.
- Fold change | Analysis cutoff
- Minimum absolute fold change for feature to be used in analysis. Features with a fold change/log ratio below this number will be uploaded, but will be ignored in the analysis. It is possible to choose between different types of fold changes: Fold change, and log-ratio.
- Fold change | Automatically calculate fold change cutoff
- Automatically calculate fold change when uploading observation. The fold change cutoff will be set so that the number of features to include in the analysis gets as close to the targeted number as possible (see below). When this option is used, it is not necessary to set the "Fold change | Analysis cutoff", since it is automatically calculated by the tool for each statistical comparison. When using this option, the fold change analysis cutoff can be different for each statistical comparison.
- Fold change | Target number of analysis features
- Enabled only when using automatically calculated fold change. The fold change cutoff will be set so that the number of features to include in the analysis gets as close to the targeted number as possible
- Upload and analysis summary
- This summary shows how many features the tool will upload to IPA for each statistical comparison, and how many features that will be included in each analysis. The values are updated when the user changes any of the analysis parameters. In this way, the user can easily check the effect of the filtering (e.g. avoid setting the filters such that no features will be analyzed).
The Upload and analysis summary table at the bottom of the dialog warns the user when too restrictive filters have been set (figure 2.5).
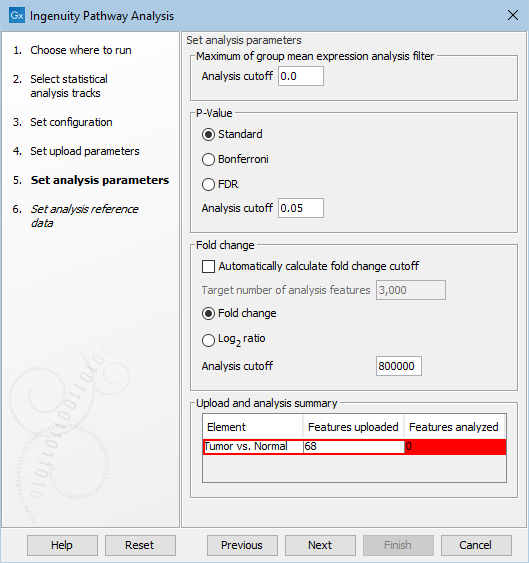
Figure 2.5: A warning highlight in red analyses for which the cutoff is too restrictive.
Click Next to choose the reference as seen in figure 2.6.
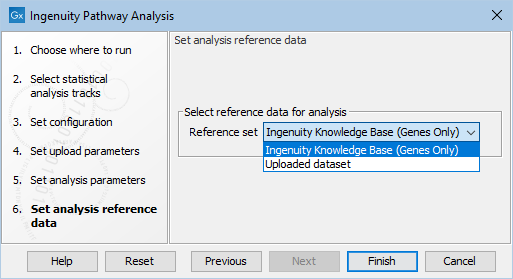
Figure 2.6: Choose the reference to be used for the analysis of the data in IPA.
The reference can be:
- Ingenuity Knowledge Base (Genes only)
IPA recognizes gene ids for several species, see
https://qiagen.secure.force.com/KnowledgeBase/KnowledgeIPAPage?id=kA41i000000L6BTCA0 for a full list.
Successive uploads to IPA are attempted, until the upload is successful:
- If the statistical comparison contains gene ids from a recognized database (Ensembl, Entrez, Hugo, or RefSeq), the ids are uploaded to IPA using the corresponding IPA identifier type. Otherwise, the 'Name' column is uploaded with IPA identifier types for Ensembl, Entrez, GenBank, miRBase (mature) and RefSeq.
- If the previous upload fails, it could be because the gene identifiers of the uploaded species are not supported by IPA. Gene names are often conserved across species, so uploads are attempted with gene names formatted according to the IPA human (upper case e.g. BRCA1) or mouse/rat (capitalized e.g. Brca1) gene names formats, using the corresponding IPA gene symbol identifier types. Uploads are performed in decreasing order of the number of unformatted gene names matching the the human and mouse/rat formats.
Note that upload is successful even if just one gene has been successfully identified by IPA. All performed uploads and their error messages from IPA for failed uploads are written to the log.
If all upload attempts fail, the upload errors from IPA will be displayed. The error "The identifier type that you selected may be incorrect. [...]" indicates that the species is not supported by IPA and the gene names did not match any of the human, mouse and rat genes.
- Uploaded dataset The data uploaded will be analyzed using itself as a reference.
Click Finish to start the tool.
Subsections