Histone ChIP-Seq
To run the Histone ChIP-Seq tool:
Toolbox | Epigenomics Analysis (![]() ) | Histone ChIP-Seq (
) | Histone ChIP-Seq (![]() )
)
In the first wizard window, select the mapped ChIP-Seq reads as input data (figure 2.1). Multiple inputs (such as replicate experiments) are accepted, provided that they refer to the same genome. It is also possible to work in batch (see ).
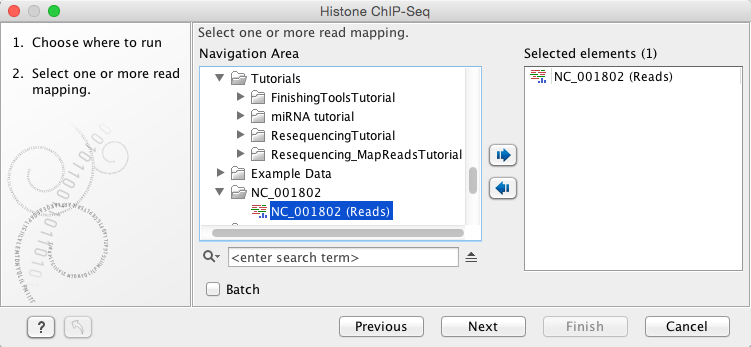
Figure 2.1: Selecting input tracks for the Histone ChIP-Seq tool.
In the second step (figure 2.2), the gene track and control data are defined, along with the p-value. This value defines which regions have a significant fit with the peak-shape, and only these are copied to the output track.
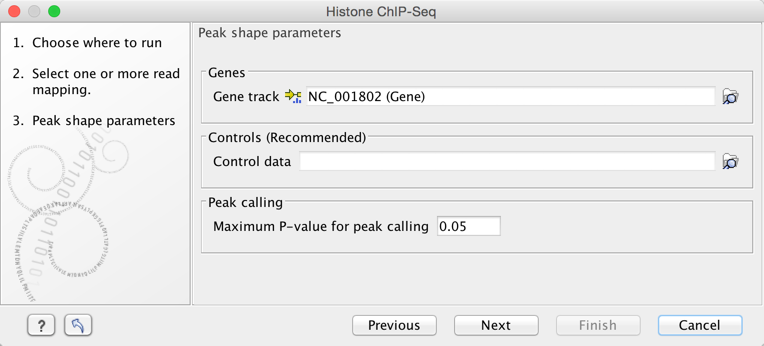
Figure 2.2: Setting peak shape parameters.
The output options are shown in figure 2.3.
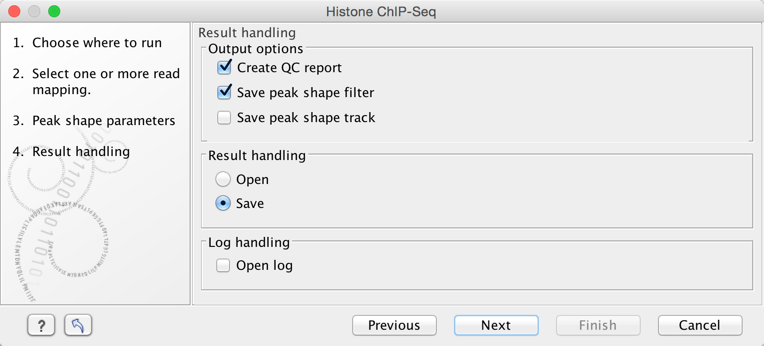
Figure 2.3: Setting up result handling.
- Create a Quality Control (QC) report with which you can check the quality of the reads. It lists the
number of mapped reads, the normalized strand coefficient, and the relative
strand correlation for each mapping. For each metric, the Status column will
be OK if the experiment has good quality or Low if the metric is not as high as expected.
Furthermore, the QC report will show the mean read length, the inferred fragment length, and the window size that the algorithm would need to be able to model the signal shape. In case the input contains paired-end reads, the report will also contain the empirical fragment length distribution.
- Save the peak-shape filter generated by the tool while processing. This filter can be used to identify
genomic regions whose read coverage profile matches the characteristic peak
shape, as well as to determine the statistical significance of this match.
The filter implemented is called Hotelling Observer and was chosen because it
is the matched filter that maximizes the AUCROC (Area Under the Curve of the
Receiver Operator Characteristic), one of the most widely used measures for algorithmic performance.
For a more detailed description of peak-shape filters, please refer to the description of the Transcription Factor ChIP-Seq tool , or to the white-paper explaining the algorithmic and statistical methods .
The peak-shape filter is then applied to the experimental data by scaling the coverage profile in
every gene region to a unit-window. The score is obtained for each region by comparing this profile to the
peak shape filter.
- Save peak shape score graph track (figure 2.4)
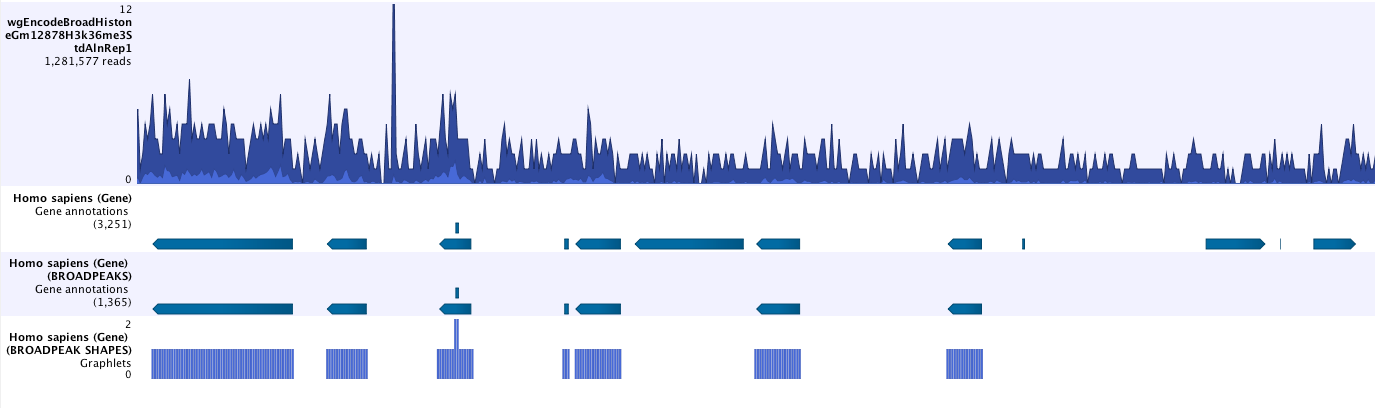
Figure 2.4: Example of Histone ChIP-Seq output.The peak shape score is standardized and follows a standard normal distribution, so a p-value for each regions is calculated. After the peak shape score for all regions is calculated, regions where the peak shape score is greater than the given threshold are copied to the output track. Hence the output only contains the gene regions where the coverage graph does match the peak-shape.