Differential Expression for Single Cell
Differential Expression for Single Cell detects differentially expressed features using expressions from an input Expression Matrix (It is often most natural to run the tool from a Dimensionality Reduction Plot by right-clicking on the plot, see UMAP and tSNE plot functionality for details. However, it can also be found in the Toolbox here:
Gene Expression (![]() ) | Expression Analysis (
) | Expression Analysis (![]() ) | Differential Expression for Single Cell (
) | Differential Expression for Single Cell (![]() )
)
The tool tests if each feature is differentially expressed and outputs Statistical Comparison Tables (![]() ).
).
The first set of options narrow down the focus of the tool:
- Clusters and Cell annotations. At least one of these must be supplied. Clusters accepts Cell Clusters (
 ) and Cell annotations accepts Cell Annotations (
 ).
).
- Test differential expression due to a single column from the supplied Cell Clusters or Cell Annotations. Columns that only contain true/false values or numerical data are not supported. Tests will be performed between the groups of cells with different labels in this column.
- Select groups (Optional). This can be supplied to reduce the number of groups of cells considered or to control the order in which comparisons are made.
It is easiest to understand the effects of these settings with example data from figure 7.1. If the table shown there were supplied as either `Clusters' or `Cell annotations', then the possible values of `Test differential expression due to' would be `Sample', `Status' or `Cell type' (the `Barcode' column is special and is excluded). If `Cell type' were chosen, then possible groups in `Select groups' would be `T cell', `B cell' and `Platelet'.
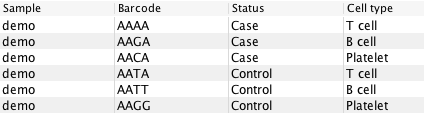
Figure 7.1: Example data consisting of cells with different cell types coming from either Case or Control samples
From now on, we will continue with this example, assuming that Test differential expression due to = Cell type. There are two possible types of tests: `All group pairs' and `Identify marker genes'.
All group pairs
In the example, there are three groups: `T cell', `B cell' and `Platelet'. When All group pairs is selected, up to 6 pairwise comparisons can be performed. Only three of these will be output, for example `T cell vs B cell', `T cell vs Platelet', and `B cell vs Platelet'. The other three tests, `B cell vs T cell', `Platelet vs T cell', and `Platelet vs B cell' will not be produced - this is because the only difference between, for example, `T cell vs B cell' and `B cell vs T cell' is the sign of the fold change.
It is possible to control exactly which comparisons are performed by using the Select groups option. The order of any selected groups determines the direction of the comparisons. For example, if Select groups = Platelet, B cell, T cell, then the comparisons will be `Platelet vs B cell', `Platelet vs T cell', and `B cell vs T cell'. If Select groups = T cell, B cell, Platelet, then the comparisons will be `T cell vs B cell', `T cell vs Platelet', and `B cell vs Platelet'.
The Select groups option can also be used to restrict the number of comparisons. If Select groups = B cell, Platelet, then the outputs will be reduced to just those involving the selected groups. In this case there would only be one output: `B cell vs Platelet'.
Identify marker genes
In the CLC Single Cell Analysis Module, marker genes are considered to be genes that are differentially expressed in the group of interest when compared to all other groups. This does not necessarily mean that they are only expressed in the group of interest, or are up-regulated in the group of interest; marker genes may also have abnormally low expression (though this is unlikely), or have an expression that, by being lower than in some groups and higher than in others, is distinctive to the group of interest.
In practice, the requirement that marker genes are differentially expressed compared to all other groups can be overly strict. For example, a group might contain so few cells that it is never possible to detect differential expression compared to this group. To avoid this problem, groups are excluded if they have no significant differentially expressed genes relative to a majority of the other groups. Here, significant means that the FDR p-value is less than 0.05.
Select groups determines the groups for which the markers have to be differentially expressed. For example if Select groups = Platelet, B cell, T cell then three sets of markers will be output `Platelet vs rest', `B cell vs rest' and `T cell vs rest'. The markers for `Platelet vs rest' will only be differentially expressed when compared to B cells or T cells - if there was another cell type in the data that had been excluded from the selected groups, then it is possible that the markers in `Platelet vs rest' would not be useful for distinguishing platelets from this additional cell type.
Marker genes are identified by first running `All group pairs' and collecting the pairwise results into marker results as detailed above.
Performing separate tests between conditions for each cell type
It is possible to make comparisons between conditions (e.g. Case vs Control) for each cell type using the option Perform a separate test for each group in. Again this is easiest to illustrate with reference to figure 7.1.
Using `All group pairs' with Test differential expression due to = Status and Perform a separate test for each group in = Cell type will give the outputs `T cell: Case vs Control', `B cell: Case vs Control', and `Platelet: Case vs Control'.
Selecting genes to be tested
When a gene is expressed in too few cells, there could be too little information to reliably detect if it is differentially expressed. A minimum number of cells expressing the gene can be set using Minimum number of cells and Minimum percentage of cells. A gene is considered to have insufficient expression in a group if one of the following is true:
- the number of cells expressing the gene is less than Minimum number of cells;
- the percentage of cells expressing the gene is less than Minimum percentage of cells.
When a pairwise comparison is performed, tests are not performed for genes with insufficient expression in both groups, and the p-value is set to NaN (not a number).
This also affects `Identify marker genes', as the markers are obtained from pairwise tests. For markers, the test for a gene is not performed when the group of interest and at least one other group have insufficient expression.
Subsections
- Interpreting the output of Differential Expression for Single Cell
- The differential expression algorithm