Taxonomic profiling abundance table
The Taxonomic profiling abundance table displays the names of the identified taxa (assemblies), along with their full taxonomy, a coverage estimate, the number of reads found in the sample that are associated with this taxon and the confidence score for the taxonomic assignment. Note that the number of reads is corrected based on the number of nucleotides to reflect lack of uniform read lengths found in long reads. The table can be visualized using the Stacked bar charts and Stacked area charts function, as well as the Sunburst charts.
- Table view (
 ) (figure 6.9)
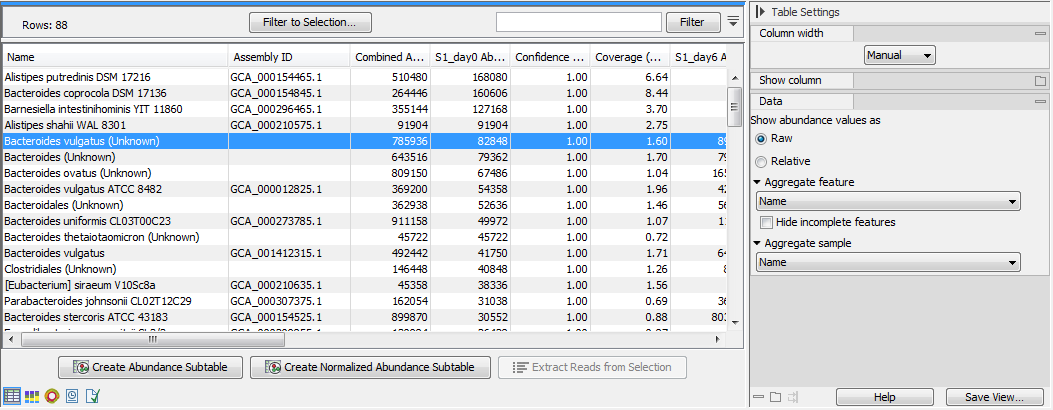
Figure 6.9: Taxonomic profiling abundance table.The table displays the following columns:
- Name: the name of the taxon, specified by the reference database or the NCBI taxonomy. If the name contains the text "(Unknown)", it indicates that this taxon corresponds to a higher-level node in the taxonomy, and that this node had a significant amount of reads associated to ancestor taxons that are present in the database but were disqualified. This indicates that there was some organism in the sample for which there is no exactly matching reference in the database, but is most likely closely related to this taxon. If the name does not contain the text "(Unknown)", it means that the sample contains this exact taxon, which is present in the database.
- Taxonomy: the taxonomy of the taxon, as specified by the reference database.
- Assembly ID: the id of the assembly (typically genbank assembly accession numbers), as specified by the reference database.
- Combined Abundance: total number of reads for the taxa across all samples
- Min, Max, Mean, Median and Std: respectively minimum, maximum, mean, median and standard deviation of the number of reads for the taxa across all samples
- Name of the sample (for example LC1 in the table above): number of reads for each sample (calculated during the quantification phase, see Taxonomic Profiling)
- Confidence (name of the sample): confidence score between 0 (low confidence) and 1 (high confidence) that indicates the confidence in the taxon being present in the sample. The reported confidence score is 1 - p-value under the null hypothesis that the reads map at random positions in the database. The process of randomly mapping reads can be described as a Bernoulli process, and the p-value can then be evaluated for each reference using the number of reads mapping to that reference. In most cases the confidence score will be 1.
- Coverage (name of the sample): coverage estimate for the sample
Adjusted abundance = (abundance in nucleotides) / (mean read length)
In the right side panel, under the tab Data, you can switch between raw and relative abundances (relative abundances are computed as the ratio between the coverage of a taxon in a specific sample and the amount of coverage in the sample). You can also combine absolute counts and relative abundances by taxonomic levels by selecting the appropriate taxonomic level in the Aggregate feature drop-down menu. Incomplete taxonomies at a given level of Aggregation can be hidden using the "Hide incomplete taxonomy" check box.
Finally, if you have previously annotated your table with Metadata (see section 7.7), you can Aggregate sample by the groups previously defined in your metadata table. This is useful when for example analyzing replicates from the same sample origin.
Above and under the table, the following actions are available:
- Filter to Selection... to have the table only displaying pre-selected rows in the table.
- Create Abundance Subtable will create a table containing only the selected rows.
- Create Normalized Abundance Subtable will create a table with all rows normalized on the values of a single selected row. The row used for normalization will disappear from the new abundance table. The normalization scales the abundance tables linearly, where the scaling factor is calculated by determining the average abundance across all samples and for each sample scale it to the average for the reference. Note that to be enabled, the selected row for normalization can only have non null abundance values. If you have zero values in some samples for the control, you will need to generate a new abundance table where these samples are not present. If the abundance table is obtained from merging single-sample abundance table, then the merge should be redone excluding the samples with zero control read counts.
- Extract Reads from Selection will extract reads uniquely associated to specific rows in the table. In order to do this, you must have opted to output and save the reads matching the reference database when running the Taxonomic Profiling tool.
- Stacked Bar Chart and Stacked Area Chart (
 )
Choose which chart you want to see using the drop down menu in the upper right corner of the side panel. In the Stacked Bar (figure 6.10) and Stacked Area Charts (figure 6.11), the metadata can be used to aggregate groups of columns (samples) by selecting the relevant metadata category in the right hand side panel. Also, the data can be aggregated at any taxonomy level selected. The relevant data points will automatically be summed accordingly.
)
Choose which chart you want to see using the drop down menu in the upper right corner of the side panel. In the Stacked Bar (figure 6.10) and Stacked Area Charts (figure 6.11), the metadata can be used to aggregate groups of columns (samples) by selecting the relevant metadata category in the right hand side panel. Also, the data can be aggregated at any taxonomy level selected. The relevant data points will automatically be summed accordingly.
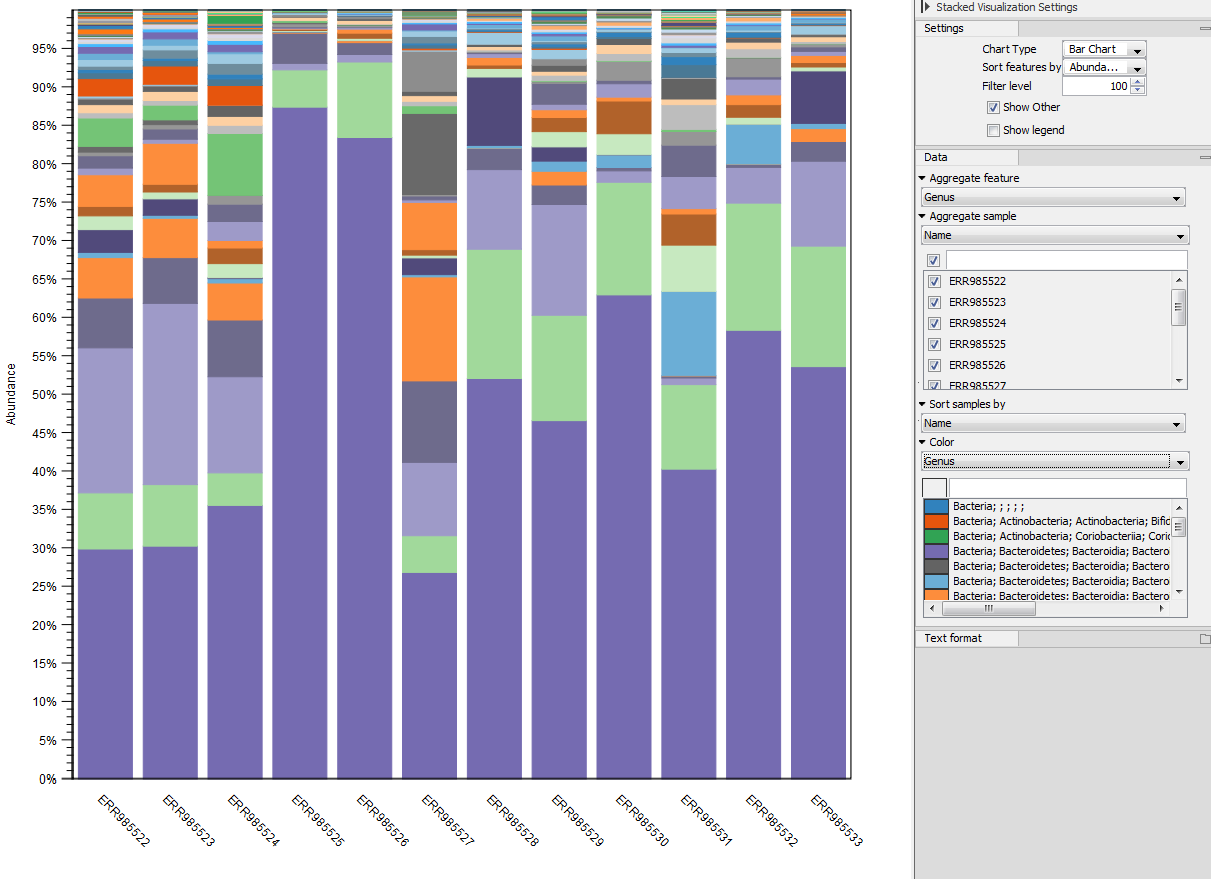
Figure 6.10: Stacked bar chart.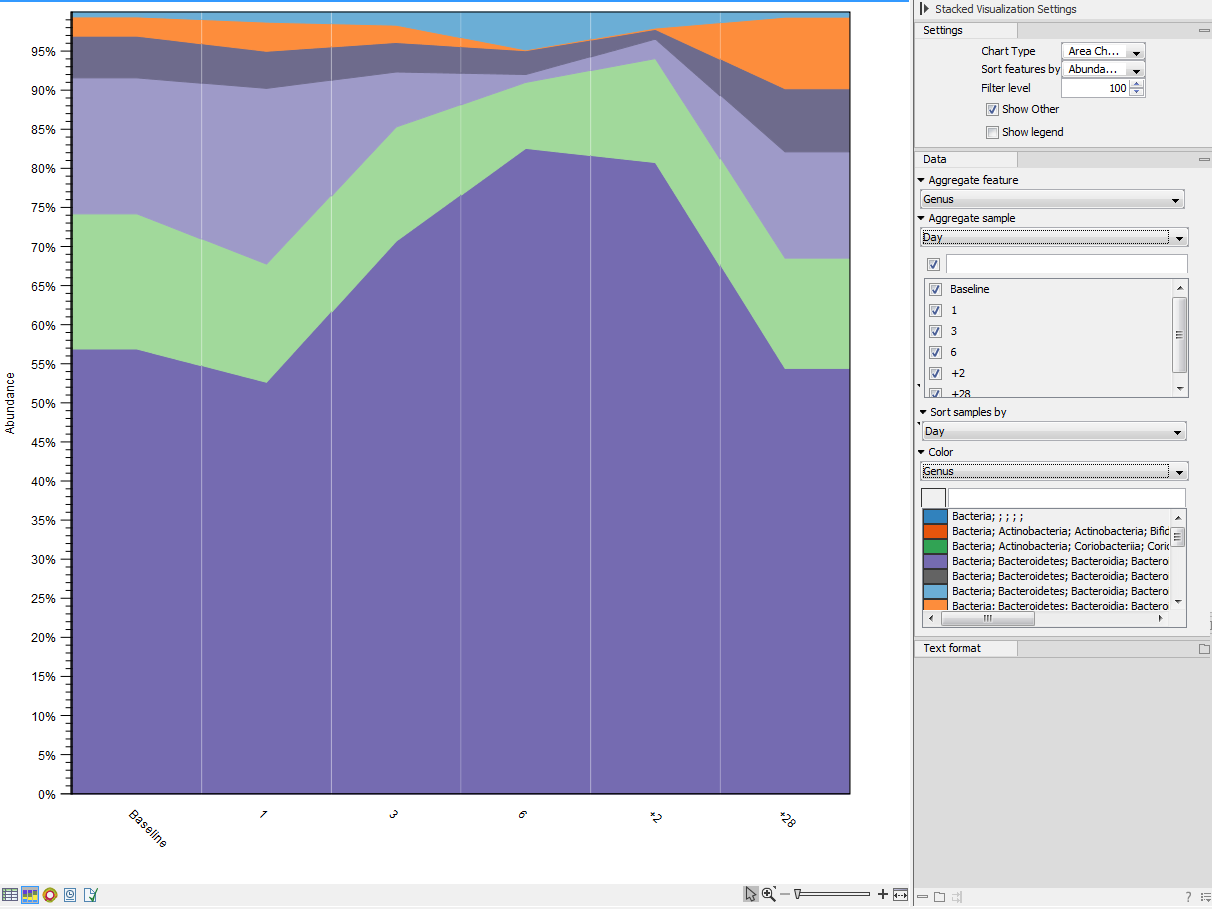
Figure 6.11: Stacked area chart.Holding the pointer over a colored area in any of the plots will result in the display of the corresponding taxonomy label and counts. Filter level allows to modify the number of features to be shown in the plot. For example, setting the value to 10 means that the 10 most abundant features of each sample will be shown in all columns. The remaining features are grouped into "Other", and will be shown if the option is selected in the right hand side panel. One can select which taxonomy level to color, and change the default colors manually. Colors can be specified at the same taxonomy level as the one used to aggregate the data or at a lower level. When lower taxonomy levels are chosen in the data aggregation field, the color will be inherited in alternating shadings. It is also possible to sort samples by metadata attributes, and to show groups of samples without collapsing their stacks, as well as change the label of each stack or group of stacks. Features can be sorted by "abundance" or "name" using the drop down menu in the right hand side panel. Using the bottom right-most button (Save/restore settings (
 )), the settings can be saved and applied in other plots, allowing visual comparisons across analyses.
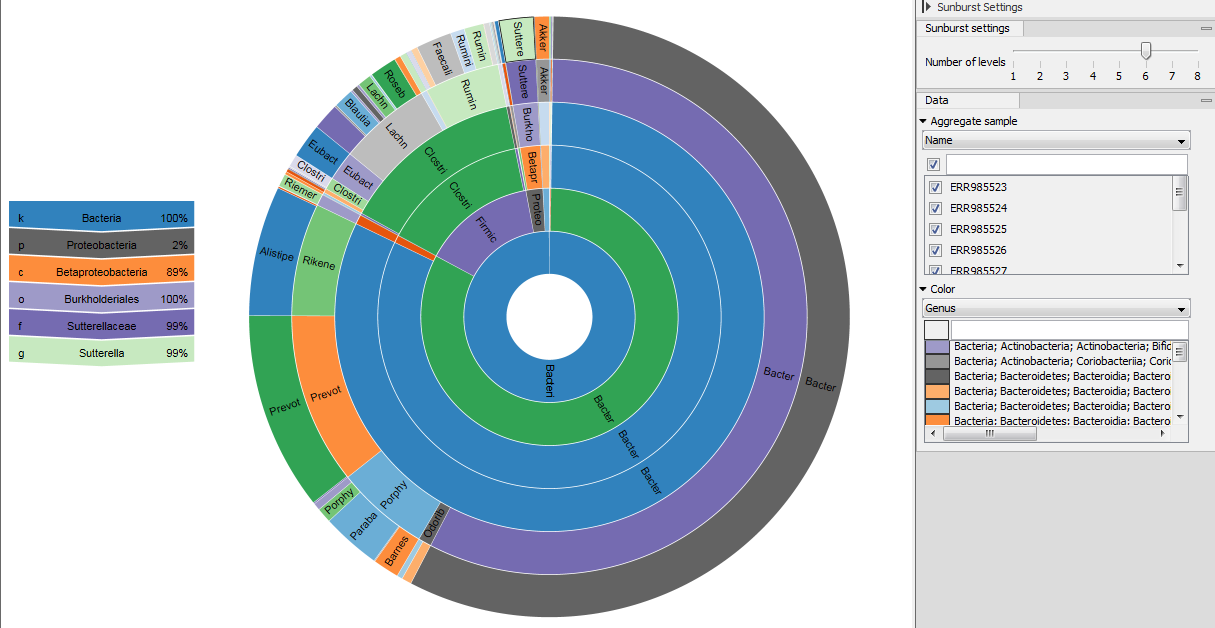
- Zoomable Sunbursts (
 )
The Zoomable Sunburst viewer lets the user select how many taxonomy level
counts to display, and which level to color. Lower levels will inherit the
color in alternating shadings. Taxonomy and relative abundances (the ratio
between the coverage of the species in a specific sample and the
total amount of coverage in the sample) are displayed in a legend to the left
of the plot when hovering over the sunburst viewer with the mouse. The metadata
can be used to select which sample or group of samples to show in the sunburst
(figure 6.12).
)
The Zoomable Sunburst viewer lets the user select how many taxonomy level
counts to display, and which level to color. Lower levels will inherit the
color in alternating shadings. Taxonomy and relative abundances (the ratio
between the coverage of the species in a specific sample and the
total amount of coverage in the sample) are displayed in a legend to the left
of the plot when hovering over the sunburst viewer with the mouse. The metadata
can be used to select which sample or group of samples to show in the sunburst
(figure 6.12).
Clicking on a lower level field will render that field the center of the plot and display lower level counts in a radial view. Clicking on the center field will render the level above the current view the center of the view.