Data QC and Taxonomic Profiling
The Data QC and Taxonomic Profiling combines the Taxonomic Profiling tool with a trimming step and additionally creates sequencing QC reports. The workflow outputs a taxonomic profiling abundance table as well as additional reports on the trimming, QC and taxonomic analysis.
To run the tool, go to:
Metagenomics (![]() ) | Taxonomic Analysis (
) | Taxonomic Analysis (![]() ) | Workflows | Data QC and Taxonomic Profiling.
) | Workflows | Data QC and Taxonomic Profiling.
You can select one or several read files to analyze (figure 5.12). When choosing several read files, they will be considered as belonging to one single sample unless the batch mode option is checked, in which case each file will be considered as an individual sample.
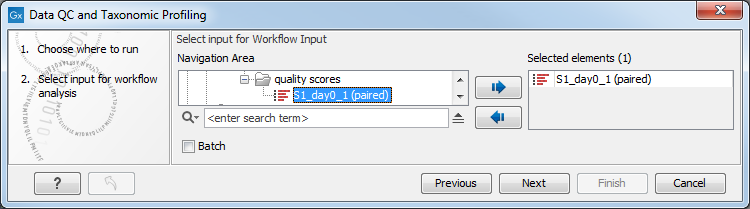
Figure 5.12: Select the reads to analyze.
In the "Trim Sequences" dialog, you can specify a trim adapter list and set up parameters if you would like to trim your sequences from adapters. Specifying a trim adapter list is optional but recommended to ensure the highest quality data for your typing analysis (figure 5.13).
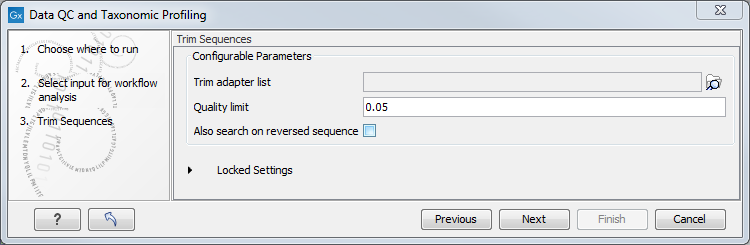
Figure 5.13: You can choose to trim adapter sequences from your sequencing reads.
The parameters that can be set are:
- Quality limit: defines the minimal value of the Phred score for which bases will not be trimmed.
- Also search on reversed sequence: the adapter sequences will also be searched on reverse sequences.
In the "Taxonomic Profiling" dialog (figure 5.14), choose the list of references that you wish to map the reads against. You could also remove host DNA by specifying a reference genome for the host (in the case of human microbiota, the Homo sapiens hg19 for example).
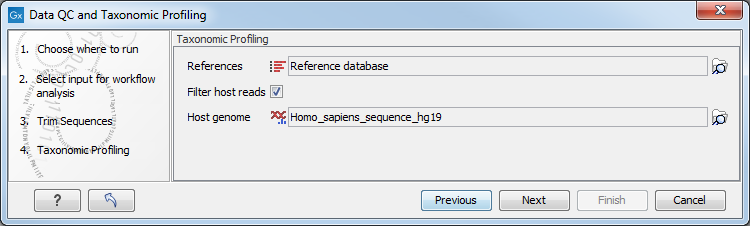
Figure 5.14: Specify the reference database. You can also check the option "Filter host reads" and specify the host genome.
The abundance table displays the names of the identified taxons, along with their full taxonomy, the total amount of reads found in the data and the confidence score for the taxonomic assignment. The table can be visualized using the Stacked bar charts and stacked area charts function, as well as the Sunburst charts (see Taxonomic profiling abundance table).
The Taxonomic Profiling report is divided in three sections:
- Taxonomic Summary includes information about which taxonomic levels were found in the data sample and how many different taxons were found on each level.
- Classification of reads summarizes the number of reads in the sample and the number of uniquely mapping reads.
- Reference database Summary gives an overview of the reference database used with the Taxonomic Profiler. A subsection is added in case any duplicates are found in the database - these are not used when constructing the taxonomic profile.
In addition, it generates three reports: a trimming report, a graphical QC report and a supplementary QC report. All of these should be inspected in order to determine whether the quality of the sequencing reads and the trimming are acceptable. For a detailed description of the QC reports and indication on how to interpret the different values, see http://resources.qiagenbioinformatics.com/manuals/clcgenomicsworkbench/current/index.php?manual=Qc_Sequencing_Report_Content.html. For the trimming report, see http://resources.qiagenbioinformatics.com/manuals/clcgenomicsworkbench/current/index.php?manual=Trim_output.html.