Report
The LightSpeed Fastq to Germline Variants report provides information about each step that has been enabled in a given analysis. In the following, each section in the report is described.
Summary
- Input read pairs Total number of read pairs in the fastq files.
- Read pairs removed by quality trimming Trimmed read pairs, that after trimming are shorter than specified in the option "Minimum read length after quality trim" and have been removed.
- Read pairs trimmed by quality trimming Read pairs that have been trimmed and are longer than "Minimum read length after quality trim".
- Read pairs removed by adapter trimming Trimmed read pairs, that after trimming are shorter than specified in the option "Minimum read length after adapter trim" and have been removed.
- Read pairs trimmed by adapter trimming Read pairs that have been trimmed and are longer than "Minimum read length after adapter trim".
- Non-specific mapped read pairs Read pairs that have multiple equally good alignments to the reference.
- Unmapped read pairs Read pairs that did not map to the reference.
- Mapped broken read pairs Mapped read pairs where the distance between the individual reads in the pair exceeded the expected distance for paired reads, or where only one of the reads in the pair was mapped.
- Removed duplicated read pairs Read pairs that were considered PCR duplicates of other reads and were removed during deduplication.
- Realigned regions The number of regions that have been locally realigned.
- Final mapped read pairs incl. non-specific The number of mapped read pairs excluding mapped broken reads and reads removed during deduplication.
- Final mapped read pairs excl. non-specific The number of mapped read pairs excluding mapped broken reads, reads removed during deduplication and non-specific mapped read pairs.
Quality trimming
- Number of read pairs Total number of read pairs in the fastq files.
- Removed read pairs Trimmed read pairs, that after trimming are shorter than specified in the option "Minimum read length after quality trim" and have been removed.
- Trimmed read pairs Read pairs that have been trimmed and are longer than "Minimum read length after quality trim".
- Trimmed R1 reads Trimmed R1 reads that are longer than "Minimum read length after quality trim".
- Trimmed R2 reads Trimmed R2 reads that are longer than "Minimum read length after quality trim".
- Average read length before trim Average read length of the raw reads in the fastq files.
- Average read length after trim Average read length after quality trimming. This read length may be longer than Average read length before trim because short reads can have been removed.
The plot Read lengths of quality trimmed reads before / after trimming shows the length and number of reads that were quality trimmed before and after trimming (figure 3.3).
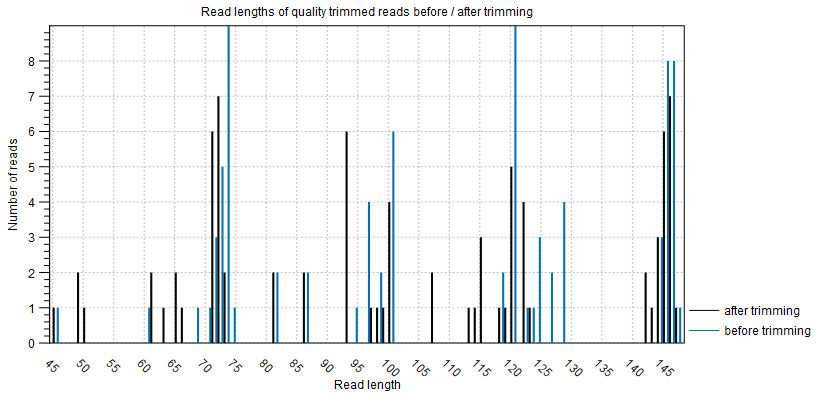
Figure 3.3: The number and length of quality trimmed reads before and after quality trimming.
Adapter trimming
- Number of read pairs Total number of read pairs in the fastq files.
- Removed read pairs Trimmed read pairs, that after trimming are shorter than specified in the option "Minimum read length after adapter trim" and have been removed.
- Trimmed read pairs Read pairs that have been trimmed and are longer than "Minimum read length after adapter trim".
- Trimmed R1 reads Trimmed R1 reads that are longer than "Minimum read length after adapter trim".
- Trimmed R2 reads Trimmed R2 reads that are longer than "Minimum read length after adapter trim".
- Average read length before trim Average length of the reads before adapter trimming. If quality trimming was enabled, read length after quality trim is given.
- Average read length after trim Average read length after adapter trimming. This read length may be longer than Average read length before trim because short reads can have been removed.
- Detected R1 adapter The consensus sequence of bases removed from R1 reads.
- Detected R2 adapter The consensus sequence of bases removed from R2 reads.
The plot Read lengths of adapter trimmed reads before / after trimming shows the number of reads as a funtion of read length before and after adapter trimming (figure 3.4).
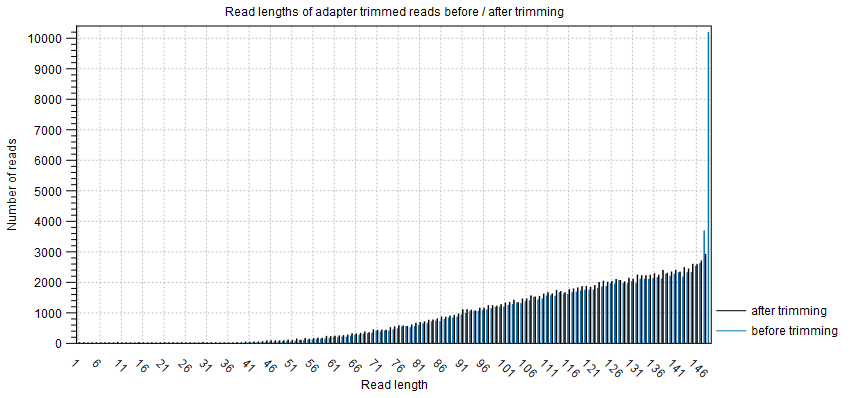
Figure 3.4: The number of reads as a function of read length before and after adapter trimming.
The plot Lengths of trimmed adapters shows the number and lengths of trimmed adapter sequences (figure 3.5).
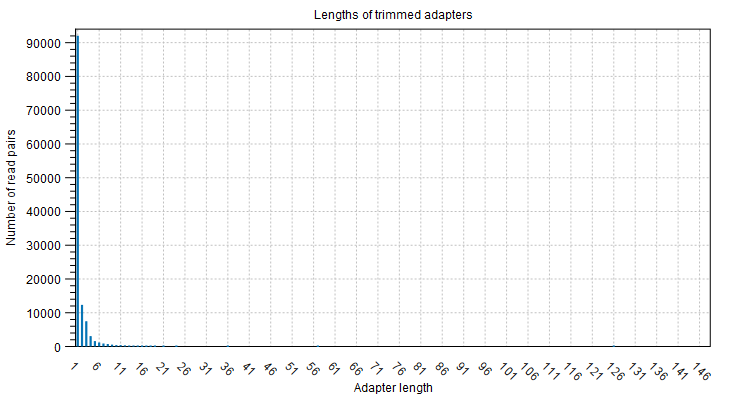
Figure 3.5: The number and length of trimmed adapter sequences.
Mapping statistics
- References The number of sequences in the reference genome.
- Total read pairs Total number of read pairs in the fastq files.
- Read pairs attempted mapped The number of read pairs left after trimming.
- Mapped read pairs The number of mapped read pairs.
- Non-specific mapped read pairs Read pairs that have multiple equally good alignments to the reference.
- Mapped broken read pairs Mapped read pairs where the distance between the individual reads in the pair exceeded the expected distance for paired reads, or where only one of the reads in the pair was mapped.
- Mapped broken read pairs, one mapped The number of broken read pairs where only one of the reads in the read pair was mapped.
- Mapped broken read pairs, both mapped The number of broken read pairs where both reads in the read pair were mapped.
- Unmapped read pairs Read pairs that did not map to the reference.