Volcano plots
Statistical comparisons also offer a volcano plot view.
An example of a volcano plot is shown in figure 30.28.
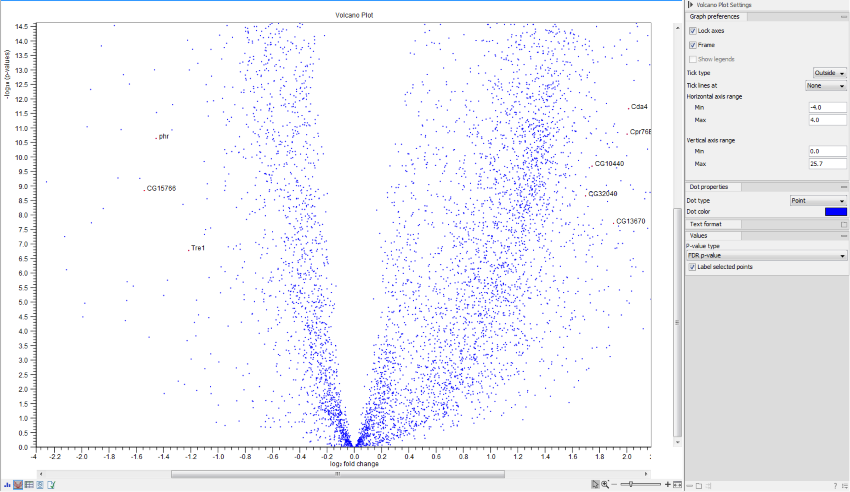
The volcano plot shows the relationship between the p-values of a statistical test and the fold changes among the samples. The log2 fold changes are plotted on the x-axis, and the -log10 p-values are plotted on the y-axis. Features of interest are typically those in the upper left and right hand corners of the volcano plot, as these have large fold changes (lie far from ![]() ) and are statistically significant (have large y-values).
) and are statistically significant (have large y-values).
Sometimes, the volcano plot will show unexpected pattern looking like "wings", such as the ones highlighted with red arrows in figure 30.29.
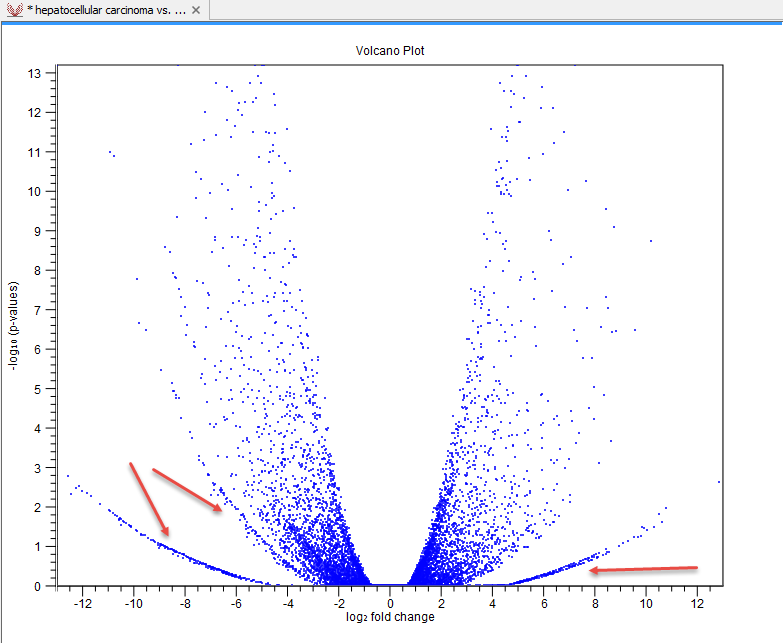
Figure 30.29: Volcano plot displaying unexpected "wing" patterns.
These patterns reflect the mathematical relationship between fold change and p-value, which often becomes exposed when there are few replicates and when expression is low in one condition. For example, expression counts for two genes might be (5,5) vs (0,0) and (5,6) vs (0,1). These two genes would appear in the same "wing". Two other genes with expression counts (5,5) vs (0,1) and (5,6) vs (0,1) might be in another "wing".
When working with several samples, it can be useful to make an Expression Browser with all the samples and to open this alongside the Volcano plot. Click a point in the Volcano plot to select it and then right-click to Select Genes in Other Views. This will select the appropriate row in the expression browser.
Volcano plot side panel It is possible to change the type of p-value from the side panel (see below).
The view settings can be adjusted using the Side Panel. Under Graph preferences, you can adjust the general properties of the volcano plot
- Lock axes This will always show the axes even though the plot is zoomed to a detailed level.
- Frame Shows a frame around the graph.
- Show legends Shows the data legends.
- Tick type Determine whether tick lines should be shown outside or inside the frame.
- Tick lines at Choosing Major ticks will show a grid behind the graph.
- Horizontal axis range Sets the range of the horizontal axis (x axis). Enter a value in Min and Max, and press Enter. This will update the view. If you wait a few seconds without pressing Enter, the view will also be updated.
- Vertical axis range Sets the range of the vertical axis (y axis). Enter a value in Min and Max, and press Enter. This will update the view. If you wait a few seconds without pressing Enter, the view will also be updated.
Below the general preferences, you find the Dot properties and Text format, where you can adjust the coloring and appearance of the dots and text.
At the bottom are options for choosing which values to display:
- P-value type Selects which type of p-value to use.
- Label selected points Chooses whether selected points should be labeled.
- Lower limit on p-values Round all p-values smaller than this number to the chosen value (for example, using the default setting, a value of zero will become 1E-16) so even small values can be visualized on a logarithmic scale volcano plot.
Note that if you wish to use the same settings next time you open a volcano plot, you need to save the settings of the Side Panel.