CDR3 length for Clonotypes
The CDR3 length plot (
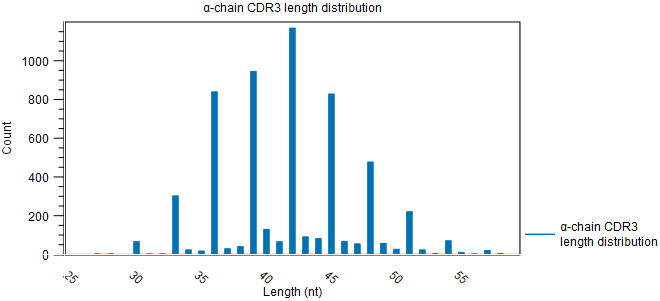
Figure 7.23: CDR3 length distribution plot for the TRA chain with peaks every 3 nt. The chain can be changed from the side panel.
Figure 7.23: CDR3 length distribution plot for the TRA chain with peaks every 3 nt. The chain can be changed from the side panel.