Taxonomic Profiling
The Taxonomic Profiling tool is designed to determine which known organisms are in a whole shotgun metagenomic sample, and how abundant they are. To this end, the tool will map each input read to a reference database of complete genomes. If a host organism genome is provided, the mapping phase will disregard reads that it deems to have originated from the host. Paired reads that cannot map as an intact pair will also be dismissed. After mapping, the tool performs qualification (by assigning the read to a taxon in the database if a match is found) and quantification of the abundance of each qualified taxon, and finally compile the results in an abundance table.
The purpose of the qualification phase is to determine whether a particular taxon is represented in a sample. In order to do that, it is possible to specify two dataset-dependent variables prior to the execution of the tool, namely the minimum number of reads and/or minimum coverage for a taxon to be reported. Any taxonomic node not meeting these minimum requirements will be ignored and the reads assigned to it will be reassigned to its closest qualified ancestor. The coverage for a given taxonomic node is calculated by the total number of reads directly assigned to the node divided by the average reference length under that node.
The purpose of the quantification phase is to estimate how abundant the qualified taxons are. It is based on the number of reads assigned to that taxon.
The detection limit of the tool is now controlled by two simple input parameters:
- the minimum number of reads
- the minimum coverage criteria
To run the Taxonomic Profiling tool, go to Microbial Genomics Module (![]() ) | Metagenomics (
) | Metagenomics (![]() ) | Taxonomic Analysis (
) | Taxonomic Analysis (![]() ) | Taxonomic Profiling (
) | Taxonomic Profiling (![]() ).
).
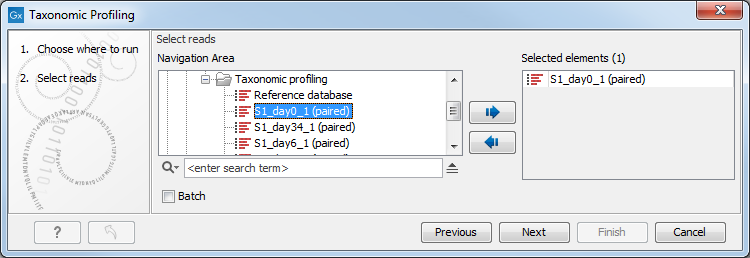
You can select one or several read files to analyze (figure 5.1). When choosing several read files, they will be considered as belonging to one single sample unless the batch mode option is checked, in which case each file will be considered as an individual sample.
In the "Parameters" dialog , provide the reference database you will use to map the reads (figure 5.2). Note that the first time you run the tool with a given database, the analysis will take longer because it is indexing and caching the database as indicated by the warning message in the dialog. Analysis time will be improved in subsequent runs, when the workbench is able to use the index generated the first time around.
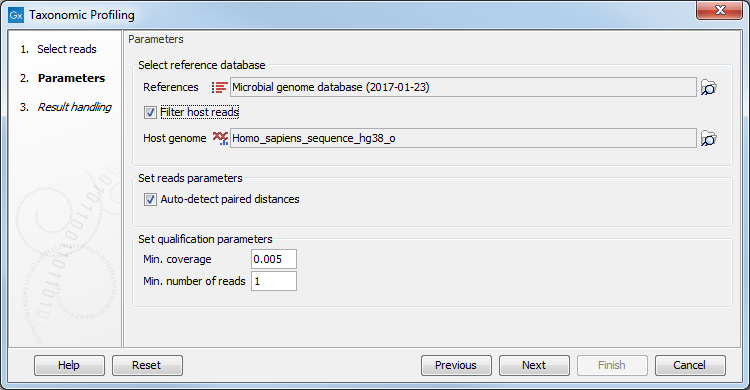
Figure 5.2: Set the parameters.
In that dialog, you can choose to "Filter host reads". You must then specify the host genome (for example the Homo sapiens hg38 in the case of human microbiota). Finally, checking the option "Auto-detect paired distances" will generate an estimate of the paired distance range in an additional section of the report output by the tool.
You can also set qualification parameters: increasing any of these two parameters will giver higher precision in the results, while lowering these will give a higher recall rate but with more possible false positives.
To estimate the optimal values of the qualification parameters for your data set, we recommend to run the tool a first time with the parameters as they are set by default. Open the resulting abundance table, sort it based on Confidence scores, and select all samples that have a confidence ![]() 0.98. Click on the button "Create Abundance Table from Selection" at the bottom of the table. Sort the new sub-table according to Combined Abundance: the lowest value is the one that can be used for the "Minimum number of reads" qualification parameter. Sort the new sub-table once more according to Coverage: the lowest value can be used for the "Minimum coverage". You can then re-run the tool with the new estimated qualification parameters to output an improved abundance table.
0.98. Click on the button "Create Abundance Table from Selection" at the bottom of the table. Sort the new sub-table according to Combined Abundance: the lowest value is the one that can be used for the "Minimum number of reads" qualification parameter. Sort the new sub-table once more according to Coverage: the lowest value can be used for the "Minimum coverage". You can then re-run the tool with the new estimated qualification parameters to output an improved abundance table.
Finally, choose from the different output options and Open or Save the results (figure 5.3).
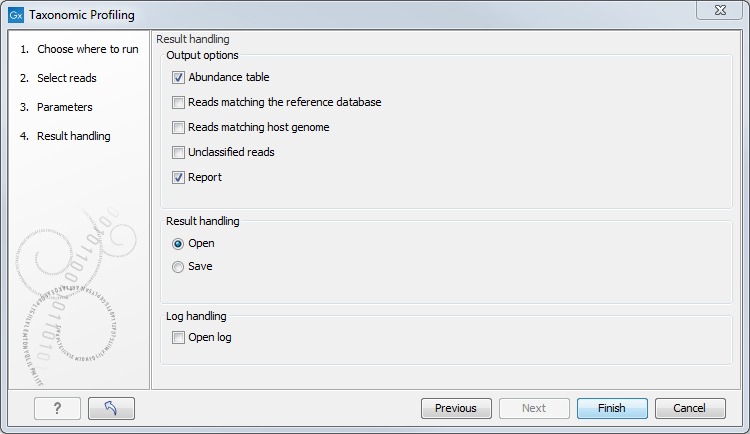
Figure 5.3: Workflow output options.
The tool will generate by default an abundance table as well as a report with a list of the taxons and their abundances. You can choose to output additional files such as a sequence lists of the reads matching the reference database and those matching the host, as well as the unclassified reads.
Subsections