Detailed mapping report
Note that this tool can be used to create a detailed report on a read mapping or a de novo assembly.
To create a detailed mapping report:
Toolbox | NGS Core Tools (![]() ) | Create Detailed Mapping Report (
) | Create Detailed Mapping Report (![]() )
)
This opens a dialog where you can select mapping results (![]() )/ (
)/ (![]() )/ (
)/ (![]() ) or RNA-Seq analysis results (
) or RNA-Seq analysis results (![]() ).
).
Clicking Next will display the dialog shown in figure 24.29
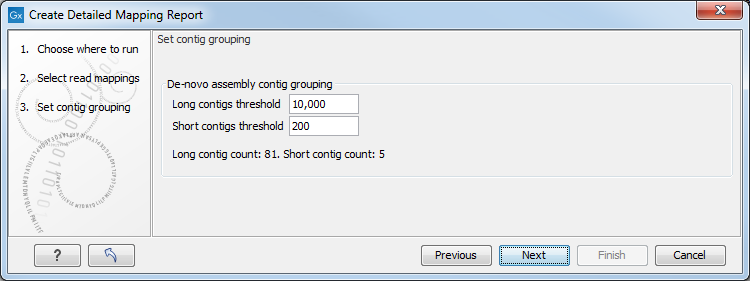
Figure 24.29: Parameters for mapping reports.
In the next wizard window "Set contig group", you can set thresholds for grouping long and short contigs. The grouping is used to show statistics like number of contigs, mean length etc. for the contigs in each group. Thresholds can only be specified for de novo assemblies that do not have a consensus sequence, i.e., these options are disabled whenever a consensus sequence is present or if you are working with a read mapping. Note that the de novo assembly in the CLC Genomics Workbench per default only reports contigs longer than 200 bp (this can be changed when running the assembly).
Click Next to select output options as shown in figure 24.30
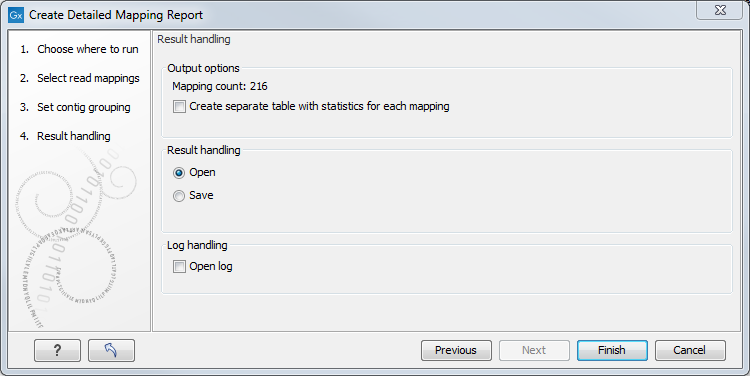
Figure 24.30: Result handling options.
By checking "Create table with statistics for each mapping", you can create a table showing detailed statistics for each reference sequence (for de novo results the contigs act as reference sequences, so it will be one row per contig).
The first section of the detailed report is a summary of the statistics: reference count, type, total reference length, GC contents in %, total read count, mean read length, and total read length
- Reference count
- Type
- Total reference length
- GC contents in %
- Total read count
- Mean read length
- Total read length
The rest of the report, as well as the optional statistic tables are described in the following sections.
Subsections