ARES Database
The ARES Database has three table views:
- a Nucleotide Marker table for gene markers. From this view, it is possible to extract a sequence list which may be used with the Find Resistance with Nucleotide Database tool.
- a Protein Marker table for gene markers.
- a Point Mutation Marker table for Single Nucleotide Polymorphism (SNP) markers. From this view, it is possible to extract a sequence list which may be used with the Find Resistance with PointFinder tool.
The database also comes with an overview report summarizing its content.
The Nucleotide Marker table
The Nucleotide Marker Table (![]() ) lists AMR marker genes together with AMR related information annotated with CARD Antibiotic Resistance Ontology (ARO) accession numbers (figure 17.1).
) lists AMR marker genes together with AMR related information annotated with CARD Antibiotic Resistance Ontology (ARO) accession numbers (figure 17.1).
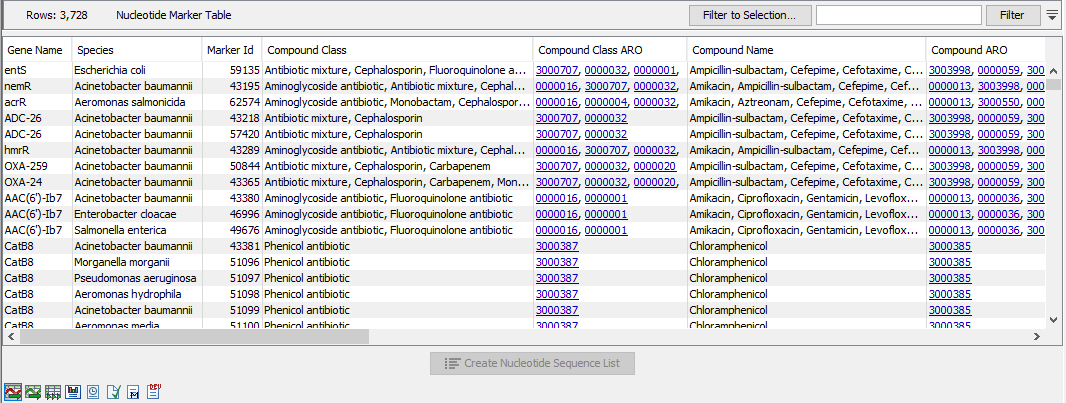
Figure 17.1: A Nucleotide Marker Table.
The table contains the following columns:
- Gene Name. The name of the resistance gene or a generic unique name starting with "group_" if no relevant gene information is available.
- Species. The name of the species for which a given resistance gene was found. The presence of a gene marker in a species different from the one listed in this column may still indicate AMR, see performance table below.
- Marker Id. An identification number for the peptide sequence of the nucleotide sequence.
- Compound Class. A list of compound classes, corresponding to the compounds in Compound Name.
- Compound Class ARO. The ARO accession numbers corresponding to the Compound Class.
- Compound Name. A list of antibiotic compounds to which the gene marker confers resistance.
- Compound ARO. The ARO accession numbers corresponding to the Compound Name.
- Start of sequence. The beginning of the gene marker sequence.
- Length. The length of the gene marker in number of nucleotides.
Click on Create a Nucleotide Sequence List to create a sequence list with unique sequences that can be used as a database for the Find Resistance with Nucleotide Database tool. Note that the underlying sequences can be the same for two different species.
The Protein Marker table
The Protein Marker Table (![]() ) lists the protein products corresponding to the sequences of the Nucleotide Marker Table (figure 17.2). The Marker Id shows the connection between nucleotide and protein markers. Note that selections in the nucleotide and protein tables are synchronized when both views are open simultaneously.
) lists the protein products corresponding to the sequences of the Nucleotide Marker Table (figure 17.2). The Marker Id shows the connection between nucleotide and protein markers. Note that selections in the nucleotide and protein tables are synchronized when both views are open simultaneously.
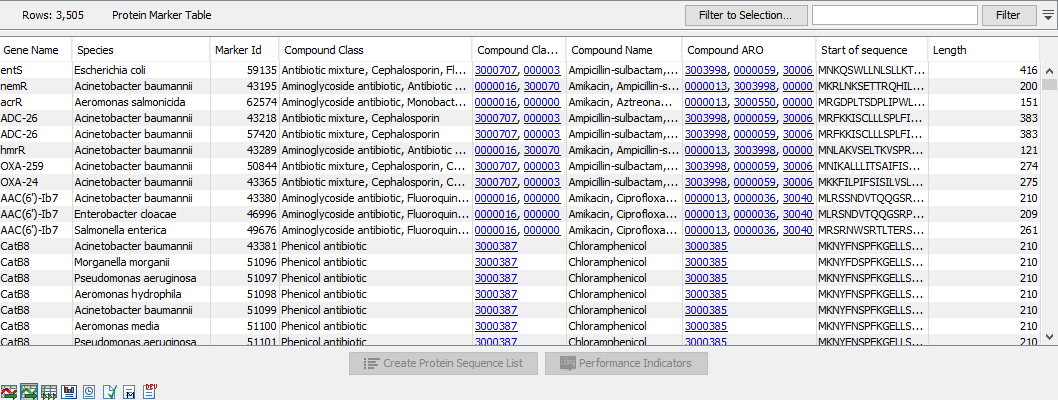
Figure 17.2: A Protein Marker Table.
The table contains the following information:
- Gene Name. The name of the resistance gene or a generic unique name starting with "group_" if no relevant gene information is available. Note that this does not necessarily correspond to the "group_" name of the nucleotide sequence as the same Marker Id can occur for multiple nucleotide sequences.
- Species. A list of species for which a given resistance gene was found in the database. The presence of a gene marker in a species different from the ones listed in this column may still indicate AMR, see the Performance Table View section below.
- Marker Id. An identification number for the peptide sequence of the nucleotide sequence.
- Compound Class. A list of compound classes, corresponding to the compounds in Compound Name.
- Compound Class ARO. The ARO accession numbers corresponding to the Compound Class.
- Compound Name. A list of antibiotic compounds to which the gene marker confers resistance.
- Compound ARO. The ARO accession numbers corresponding to the Compound Name.
- Start of sequence. The beginning of the gene marker sequence.
- Length. The length of the gene marker in number of nucleotides.
From this table, it is possible to Create a Protein Sequence List, i.e., an annotated protein sequence list of gene markers for the proteins and species of interest. Furthermore, the button Performance Indicators opens another table with the performance statistics obtained from experimental data.
The Point Mutation Marker table
The Point Mutation Marker table (![]() ) gives an overview of resistance conferring single-nucleotide polymorphisms (SNP's) and their performance data (figure 17.3).
) gives an overview of resistance conferring single-nucleotide polymorphisms (SNP's) and their performance data (figure 17.3).
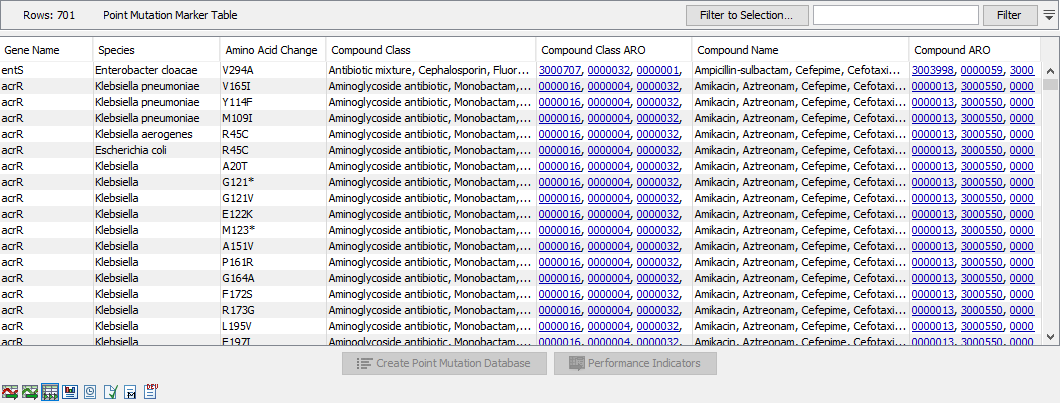
Figure 17.3: A Point Mutation Marker Table.
The columns of the Point Mutation Marker Table are:
- Gene Name. The name of the resistance gene or a generic unique name starting with "group_" if no relevant gene information is available.
- Species. A list of species for which a given resistance gene was found in the database. The presence of a point mutation in a species different from the ones listed in this column may still indicate AMR, see the Performance Table View section below.
- Amino Acid Change. This describes the change on the protein level.
- Compound Class. A list of compound classes, corresponding to the compounds in Compound Name.
- Compound Class ARO. The ARO accession numbers corresponding to the Compound Class.
- Compound Name. A list of antibiotic compounds to which the point mutation confers resistance.
- Compound ARO. The ARO accession numbers corresponding to the Compound Name.
From this table it is possible to create a sequence list which can be used as a database for the Find Resistance with PointFinder tool by pressing the Create Point Mutation Database button and each mutation is associated with performance data which can be accessed by clicking the button Performance Indicators.
The Performance Indicators table
Microbial susceptibility to various compounds may depend on a combination of multiple genetic factors and/or be specific to certain organism. As such, the presence of a single gene or variant marker is not a clear indication of whether an isolate is resistant to compound or class or class of compounds. The ARES Performance Indicators table (figure 17.4) provides a measure for how well a given gene marker is expected to perform for a given compound and species. The gene marker statistics is not only calculated for the species the marker was originally identified in, but for other species as well.
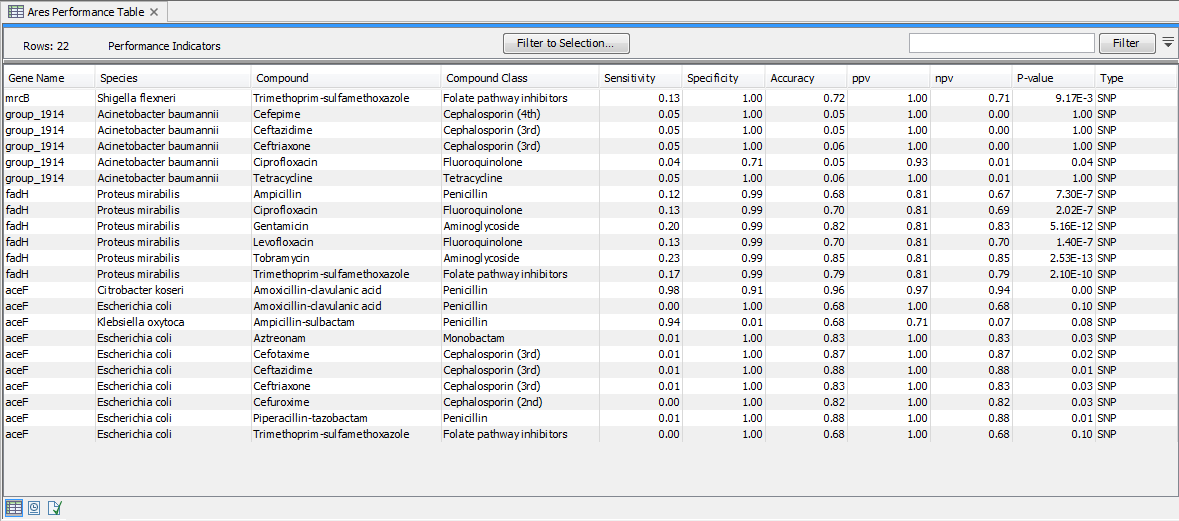
Figure 17.4: A Performance Table.
The ARES Performance Indicators tables were derived by identifying the gene markers in a large collection of isolates with known resistance profiles. Based on the presence of the gene markers in the isolates, confusion matrix statistics (https://en.wikipedia.org/wiki/Confusion_matrix) were calculated for a large number of marker, species, and compound combinations. In confusion matrix terms, resistant isolates are considered 'positives' and susceptible isolates are considered 'negatives'. For example, a resistant isolate with a given gene marker is considered a 'true positive', and a resistant isolate without a given gene marker is a 'false negative'.
- Gene Name. The name of the resistance marker evaluated in the light of antimicrobial susceptibility test data. Note, that these can be either complete gene markers or single-nucleotide polymorphisms (see the Type column).
- Species. The name of the species used in the antimicrobial susceptibility test.
- Compound. The name of the compound used in the antimicrobial susceptibility test.
- Compound Class. The compound class for the compound these statistics are calculated for.
- Sensitivity. The number of resistant isolates with the marker divided by the total number of resistant isolates in the confusion matrix.
- Specificity. The number of susceptible isolates without the marker divided by the total number of susceptible isolates in the confusion matrix.
- Accuracy. The (Number of resistant isolates with the marker + Number of susceptible isolates without the marker) divided by the total number of isolates.
- ppv. The positive predictive value is calculated as the number resistant isolates with the marker divided by the number of isolates with the marker.
- npv. The negative predictive value is calculated as the number of susceptible isolates without the marker divided by the number of isolates without the marker.
- P-value. A P-value calculated using Fisher's exact test based on the confusion matrix numbers.
- Type. This indicates whether it is a gene coding sequence (CDS) or a single-nucleotide polymorphism (SNP) marker.
The table with performance data is synchronized with the protein table and a selection made in the former will trigger a selection in the latter.
The ARES Database Overview Report
The ARES database overview contains some summary statistics on the content of the ARES database (figure 17.5).
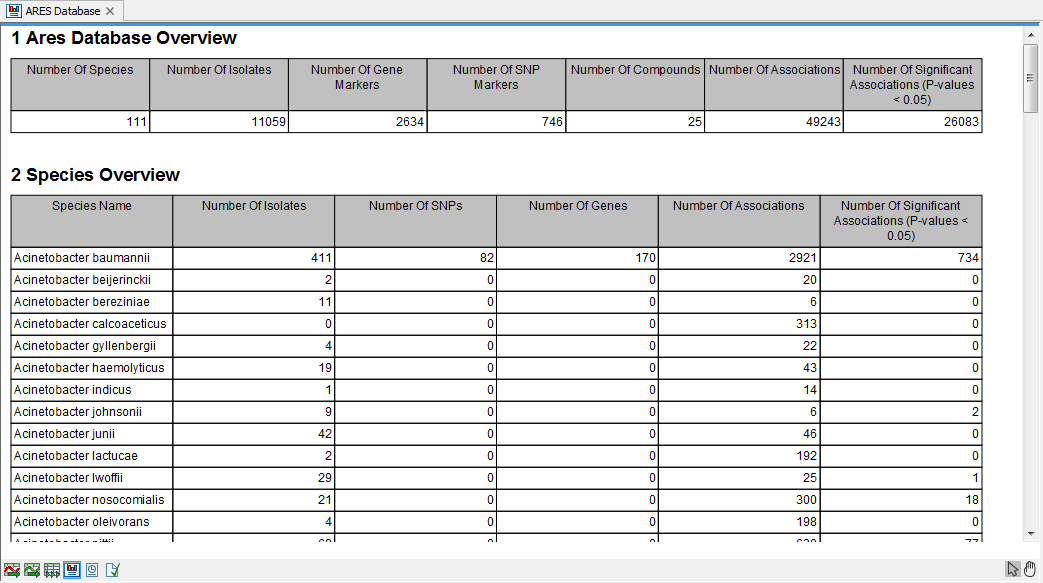
Figure 17.5: An example of ARES Database Overview Report.
- Number of Isolates. The number of isolates that have been experimentally tested for resistance against multiple compounds
- Number of SNPs. The number of single-nucleotide polymorphisms (corresponding to the entries in the Point Mutation Marker Table)
- Number of Genes. The number of gene markers (corresponding to the entries in the Protein Marker Table)
- Number of Associations. This is the number of entries in the ARES Performance tables described in the previous section
- Number of Significant Associations (P-values < 0.05). The number of performance table entries where the Fisher's exact test P-value was less than 5%. The values are not corrected for multiple testing.