Figure 30.16: A track list containing a reads track, an annotation track and a variant track.
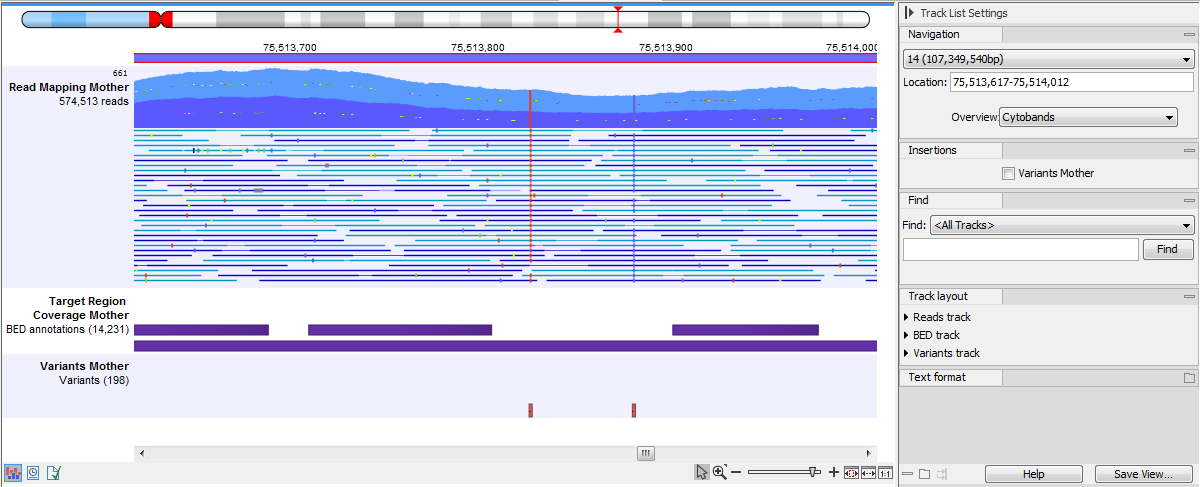
Reads tracks can be included in a track list with other tracks that are based on a compatible genome, allowing for convenient, comparative visual analysis. For example, the track list shown in figure 30.16 contains, from top to bottom, a cytoband overview, a reads track, an annotation track of target regions, and a variant track.
Figure 30.16: A track list containing a reads track, an annotation track and a variant track.
Reads tracks contain only the reads, placed where they mapped using the relevant reference genome coordinates. The information available when viewing a reads track depends on how far you zoom out or in.
When zoomed out to the point where the mapped reads are aggregated, as shown in figure 30.17, the height of the graph reflects the read coverage of that region, with the shade of blue representing the maximum, average and minimum coverage of the positions in that region:
A tooltip is shown when hovering the mouse cursor over any position in the track, reporting these values and the length of the region where those values apply.
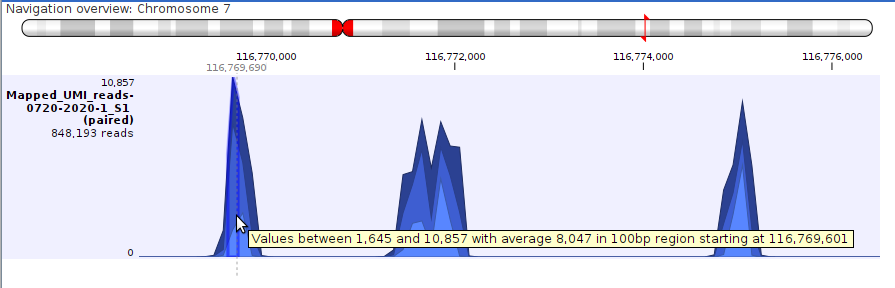
Figure 30.17: Shades of blue in an aggregated reads track represent the maximum, average and minimum reads coverage. Hovering the mouse cursor over a position brings up a tooltip with informaton about the coverage in that region.
When zoomed in fully, the individual nucleotide bases of each read are displayed (figure 30.18). A few reads are shown in detail, with the rest summarized in an coverage graph above. To see more reads in detail, increase the height of the reads track. For mappings where the coverage is deeper than the track height, a vertical scrollbar will appear when hovering the mouse cursor over the right hand side of the reads track. Use this to scroll through and view the details of all reads in the reads track.
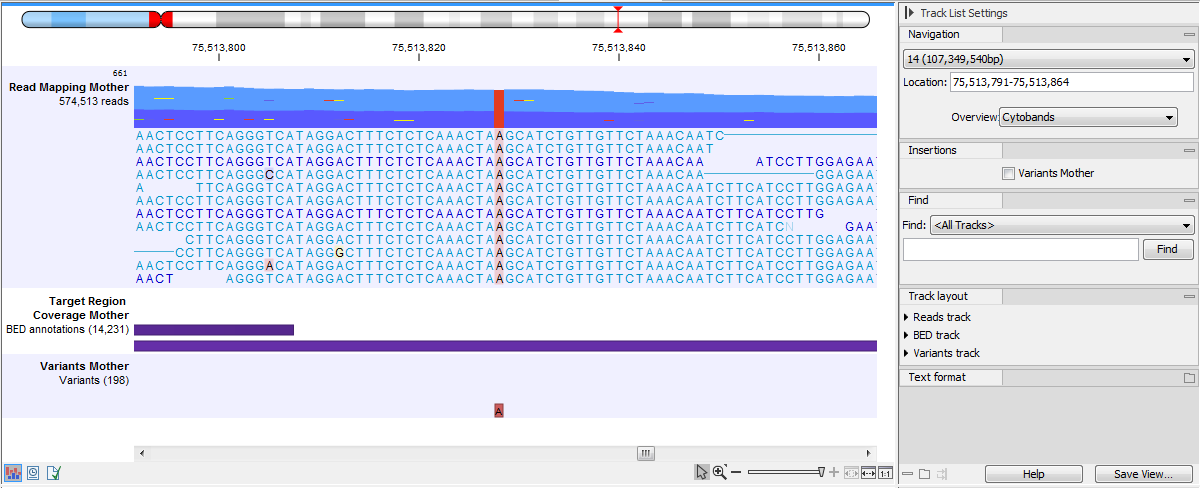
Figure 30.18: Zoom in fully to see the nucleotide bases of each read.
Reads that map across the origin of circular genomes are displayed at both the start and end of the mapping, and are marked with double arrows » at the ends of the read to indicate that the read continues at the other end of the reference sequence.
When fully zoomed into a reads track, you can:
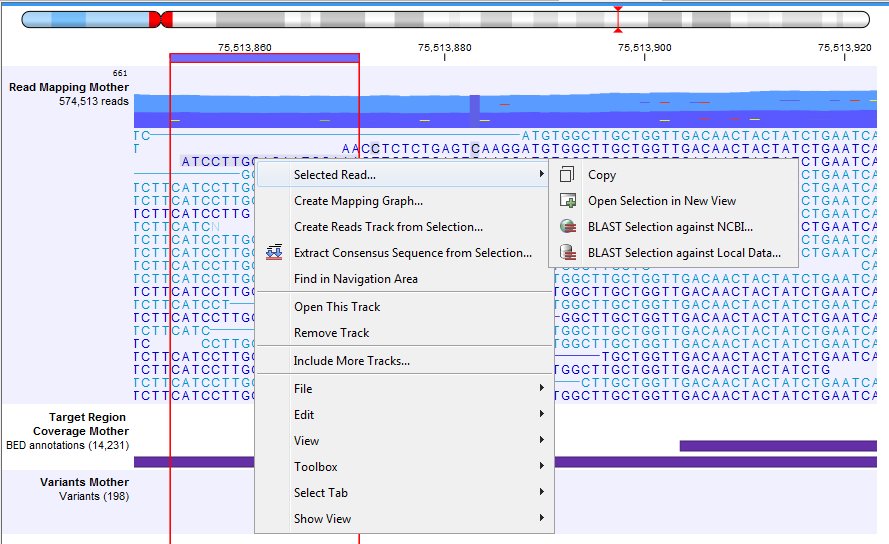
Figure 30.19: Adjusting the height of the track.
The tooltip uses the following symbols for the counts:
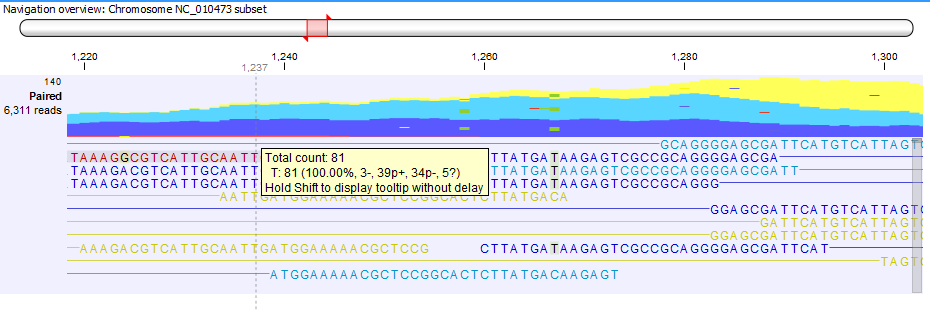
Figure 30.20: Example of tooltip information in a non-aggregated view of a reads track containing paired reads.
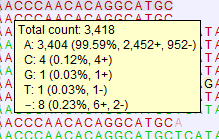
Figure 30.21: Example of tooltip information in a non-aggregated view of a reads track containing single reads. In this example, 8 reads support a deletion.
Tip: With larger mappings, there can be a short delay before the tooltip appears. To speed this up, click on the Shift key while moving the mouse over the reads. Tooltips then appear without delay.
For information on the side panel settings for reads tracks, see Reads tracks Side Panel settings.