Contig statistics for de novo assembly
After the summary there is a section about the contig lengths. For each set of contigs, you can see the number of contigs, minimum, maximum and mean lengths, standard deviation and total contig length (sum of the lengths of all contigs in the set). The contig sets are:
- N25 contigs
- The N25 contig set is calculated by summarizing the lengths of the biggest contigs until you reach 25 % of the total contig length. The minimum contig length in this set is the number that is usually used to report the N25 value of a de novo assembly.
- N50
- This measure is similar to N25 - just with 50 % instead of 25 %. This is probably the most well-known measure of de novo assembly quality - it is a more informative way of measuring the lengths of contigs.
- N75
- Similar to the ones above, just with 75 %.
- All contigs
- All contigs that were selected.
- Long contigs
- This contig set is based on the threshold set in the dialog in figure 25.10.
- Short contigs
- This contig set is based on the threshold set in the dialog in figure 25.10. Note that the de novo assembly in the CLC Genomics Workbench per default only reports contigs longer than 200 bp.
Next follow two bar plots showing the distribution of coverage with coverage level on the x-axis and number of positions with that coverage on the y-axis. An example is shown in figure 25.15.
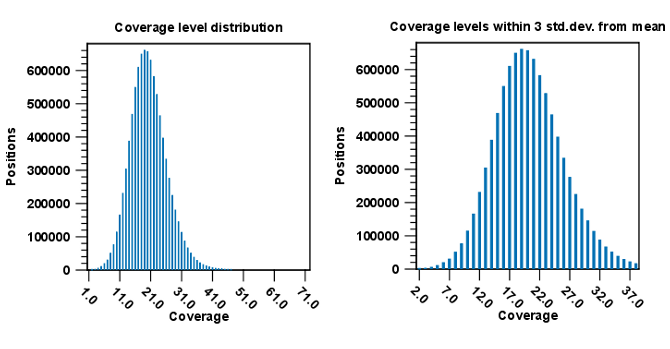
Figure 25.15: Distribution of coverage - to the left for all the coverage levels, and to the right for coverage levels within 3 standard deviations from the mean.
The graph to the left shows all the coverage levels, whereas the graph to the right shows coverage levels within 3 standard deviations from the mean. The reason for this is that for complex genomes, you will often have a few regions with extremely high coverage which will affect the resolution of the graph, making it impossible to see the coverage distribution for the majority of the references. These coverage outliers are excluded when only showing coverage within 3 standard deviations from the mean. Below the second coverage graph there are some statistics on the data that is outside the 3 standard deviations. At the end follows statistics about the reads which are the same for both reference and de novo assembly (see Read statistics).