Error-correction report
In the last dialog of the wizard, you can choose to create a report of the results (see figure 14.5).
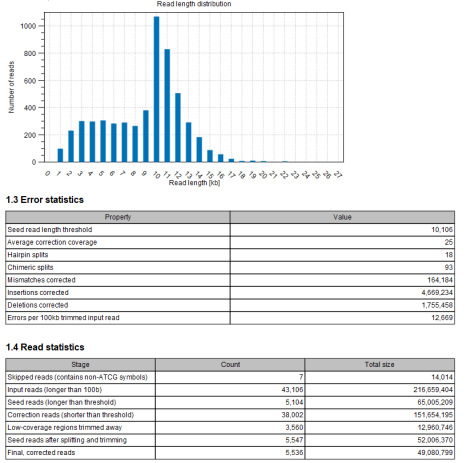
Figure 14.5: The error-correction report is useful for evaluating the quality of the input data and the performance of the error-correction.
The report contains the following information for the input reads and the corrected reads:
- Nucleotide distribution:
- Fraction of the reads covered by each nucleotide, A, C, G and T.
- Count:
- The total number of reads.
- Minimum, maximum, average, N50 and N90:
- Read length statistics.
- Total:
- The total number of bases.
- Read length distribution:
- A graph showing the number of contigs of different lengths.
In addition to this, some statistics about the error correction are given:
- Seed read length threshold
- The length of the shortest seed read used as seed read - picked according to the Coverage percentage of reads to correct (see above).
- Average correction coverage
- The average coverage by correction reads on seed reads.
- Hairpin splits
- The number of splits performed due to putative untrimmed hairpin adapter sequences.
- Chimeric splits
- The number of splits performed due to putative chimeras.
- Mismatches corrected
- The number of mismatches that have been corrected in the output reads.
- Insertions corrected
- The number of insertions that have been corrected in the output reads.
- Deletions corrected
- The number of deletions that have been corrected in the output reads.
- Errors per 100kb trimmed input read
- The total number of errors (mismatches, insertions and deletions) that have been corrected per 100kb in the output reads.
Finally, the number and total size of the following elements are given:
- Skipped reads (contains non-ATCG symbols)
- Input reads (longer than 100bp)
- Seed reads (longer than threshold)
- Correction reads (shorter than threshold)
- Low coverage regions trimmed away
- Seed reads after splitting and trimming
- Final, corrected reads