The properties & interactions panel
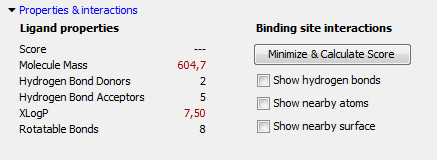
Figure 10.41: The properties on the left side of the properties & interactions panel are updated dynamically. The binding site interactions features are available only if a binding site has been added to the project.
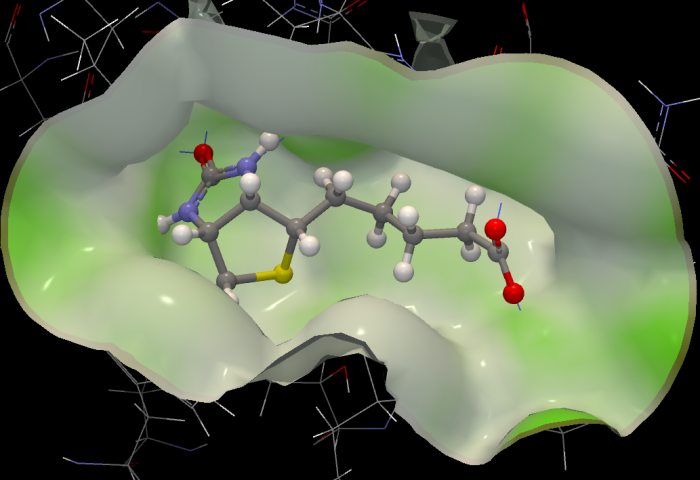
Figure 10.42: A surface showing nearby parts of the protein. The surface is colored according to hydrophobicity - green spots are hydrophilic, polar regions of the protein.
The left part of the properties & interactions panel displays a number of standard descriptors, which are updated automatically whenever the ligand is modified (figure 10.41). These descriptors include the Lipinski's rule of five descriptors. Lipinski rule of five violations will be indicated with red text.
Note: The right part of the properties & interactions panel is only enabled when a binding site is present in the workspace.
The Minimize & Calculate Score button makes it possible to perform an energy minimization with regards to the protein environment defined by the Setup Binding Site dialog. This minimization only changes the overall position, rotation, and any dihedral angles in the ligand. It will not change bond lengths and angles, or change ring conformations. The score mimics the potential energy change when the protein and ligand come together. This means that a very negative score corresponds to a strong binding and a less negative or even positive score corresponds to a weak or non-existing binding. You can read more about the scoring function in The docking algorithms.
The checkboxes on the right part of the properties & interactions panel make it possible to visualize interactions between the ligand and the binding site as defined in the Binding Site Setup. Show hydrogen bonds toggles on the display of hydrogen bonds between the ligand and the binding site molecules. Show nearby atoms shows atoms in steric contact with the ligand. Show nearby surface shows the surface boundary for the parts of the binding site in contact with the ligand (figure 10.42). The surface is two-sided: it is opaque when viewed from the inside, but transparent from the outside in order to make it possible to manipulate ligands buried in deep binding pockets. The surface is colored according to a hydrophobicity measure: green areas correspond to hydrophilic regions (regions with polar atoms capable of forming hydrogen bonds), while the white areas are purely hydrophobic.